Part of the 1985 Irish local elections
1985 North Tipperary County Council election
|
| ← 1979 | 20 June 1985 | 1991 → |
|
All 21 seats on North Tipperary County Council |
|---|
| | First party | Second party | Third party | | | | | | | Party | Fianna Fáil | Fine Gael | Labour | | Seats won | 12 | 6 | 1 | | Seat change | +3 | -2 | -2 |
| | | Fourth party | | | | | | | Party | Independent | | | Seats won | 2 | | | Seat change | +1 | | |
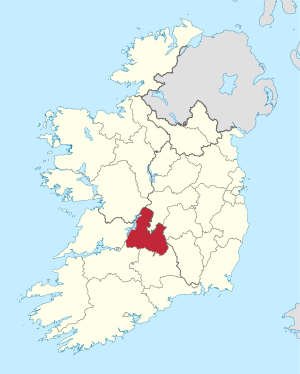 Map showing the area of North Tipperary County Council |
| | Council control after election
TBD
| |
An election to North Tipperary County Council took place on 20 June 1985 as part of the Irish local elections. 21 councillors were elected from four local electoral areas (LEAs) for a five-year term of office on the electoral system of proportional representation by means of the single transferable vote (PR-STV). This term was extended for a further year, to 1991.[1]
Results by party
| Party | Seats | ± | First Pref. votes | FPv% | ±% |
| | Fianna Fáil | 12 | +3 | 15,818 | 52.78 | |
| | Fine Gael | 6 | -2 | 8,736 | 29.15 | |
| | Labour | 1 | -2 | 3,784 | 12.63 | |
| | Independent | 2 | +1 | 1,649 | 5.50 | |
| Totals | 21 | - | 28,588 | 100.00 | — |
Results by local electoral area
Borrisokane
Borrisokane: 4 seats | Party | Candidate | FPv% | Count |
| 1 | 2 | 3 | 4 | 5 |
| | Fianna Fáil | Jim Casey | | 1,089 | 1,094 | 1,120 | 1,174 | |
| | Fianna Fáil | Michael Hough* | | 966 | 975 | 1,028 | 1,068 | 1,284 |
| | Fianna Fáil | Tony McKenna* | | 876 | 888 | 931 | 957 | 1,325 |
| | Fine Gael | Liam Whyte* | | 742 | 762 | 838 | 1,077 | 1,115 |
| | Fianna Fáil | John Carroll | | 616 | 662 | 712 | 729 | |
| | Fine Gael | Paddy Brennan | | 518 | 553 | 599 | 757 | 785 |
| | Fine Gael | Gerard Darcy | | 461 | 502 | 554 | | |
| | Labour | Jim Hough | | 288 | 409 | | | |
| | Labour | Maureen Carmody | | 277 | | | | |
| Electorate: 7,793 Valid: 5,833 (75.66%) Spoilt: 54 Quota: 63 Turnout: 5,896 |
Nenagh-Newport
Nenagh-Newport: 7 seats | Party | Candidate | FPv% | Count |
| 1 | 2 | 3 | 4 | 5 | 6 | 7 | 8 | 9 | 10 | 11 |
| | Labour | John Ryan TD* | | 1,243 | 1,270 | 1,295 | | | | | | | | |
| | Fianna Fáil | Mairead Ryan | | 1,183 | 1,194 | 1,328 | | | | | | | | |
| | Fianna Fáil | Tom Harrington* | | 1,056 | 1,066 | 1,130 | 1,161 | 1,182 | 1,190 | 1,191 | 1,438 | | | |
| | Independent | Joseph O'Connor* | | 946 | 949 | 959 | 1,034 | 1,090 | 1,092 | 1,093 | 1,130 | 1,133 | 1,287 | |
| | Fianna Fáil | John Sheehy* | | 792 | 793 | 843 | 865 | 928 | 945 | 948 | 1,055 | 1,112 | 1,523 | |
| | Fine Gael | Tom Ryan | | 770 | 773 | 775 | 860 | 899 | 899 | 899 | 916 | 917 | 1,005 | 1,030 |
| | Fine Gael | Tom Berkery* | | 739 | 751 | 757 | 815 | 953 | 954 | 955 | 1,007 | 1,013 | 1,046 | 1,062 |
| | Fianna Fáil | Ger Ryan* | | 690 | 693 | 718 | 782 | 789 | 792 | 792 | 852 | 909 | | |
| | Fine Gael | Willie Kennedy | | 688 | 715 | 726 | 739 | 836 | 837 | 838 | 1,010 | 1,041 | 1,065 | 1,077 |
| | Fianna Fáil | Jacksie Ryan | | 677 | 680 | 717 | 727 | 767 | 780 | 785 | | | | |
| | Fine Gael | Martin O'Sullivan | | 495 | 496 | 547 | 561 | | | | | | | |
| | Fianna Fáil | Ned Foley | | 429 | 430 | | | | | | | | | |
| | Labour | Frank Lewis* | | 419 | 446 | 451 | | | | | | | | |
| | Labour | Mary Brosnan | | 133 | | | | | | | | | | |
| Electorate: 13,646 Valid: 10,260 (76.13%) Spoilt: 129 Quota: 1,283 Turnout: 10,389 |
Roscrea-Templemore
Roscrea-Templemore: 5 seats | Party | Candidate | FPv% | Count |
| 1 | 2 | 3 | 4 | 5 | 6 | 7 |
| | Fianna Fáil | Sen. Michael Smith* | | 1,948 | | | | | | |
| | Fianna Fáil | Seán Mulrooney | | 1,071 | 1,344 | | | | | |
| | Fianna Fáil | John Egan* | | 1,035 | 1,337 | | | | | |
| | Fine Gael | Denis Ryan* | | 834 | 895 | 935 | 954 | 969 | 1,303 | |
| | Fine Gael | Denis Meagher | | 700 | 755 | 763 | 796 | 846 | 924 | 1,026 |
| | Fine Gael | John Butler | | 679 | 703 | 710 | 747 | 783 | 840 | 873 |
| | Labour | Tommy Shanahan* | | 560 | 603 | 651 | 659 | 731 | | |
| | Labour | Kevin Devaney | | 178 | 200 | 204 | 217 | | | |
| Electorate: 9,696 Valid: 7,005 (73.08%) Spoilt: 81 Quota: 1,168 Turnout: 7,086 |
Thurles
Thurles: 5 seats | Party | Candidate | FPv% | Count |
| 1 | 2 | 3 | 4 | 5 |
| | Fianna Fáil | Jane Hanafin* | | 1,751 | | | | |
| | Fine Gael | Michael Lowry* | | 1,542 | | | | |
| | Fianna Fáil | Harry Ryan* | | 978 | 1,140 | 1,193 | | |
| | Independent | Frank Dwan* | | 703 | 826 | 870 | 878 | 1,156 |
| | Labour | Andrew Callinan | | 686 | 747 | 795 | 807 | |
| | Fianna Fáil | Larry Looby | | 661 | 879 | 916 | 930 | 1,061 |
| | Fine Gael | Mae Quinn | | 568 | 609 | 805 | 818 | 1,020 |
| Electorate: 10,297 Valid: 6,871 (67.55%) Spoilt: 85 Quota: 1,146 Turnout: 6,956 |
References
- ^ Local Elections (Specification of Local Election Year) Order 1990 (S.I. No. 104 of 1990). Signed on 30 April 1990. Statutory Instrument of the Government of Ireland. Retrieved from Irish Statute Book.
External links
- irishelectionliterature
- Department of the Environment, Ireland (28 January 2010). "Local elections, 1985 : election results and transfer of votes in respect of each county, and county borough council : and election statistics relating to all local authorities" (PDF). Department of the Environment. Retrieved 28 October 2019.


