1994 Faroese general election
 | ||||||||||||||||||||||||||||||||||||||||||||||||||
This lists parties that won seats. See the complete results below.
| ||||||||||||||||||||||||||||||||||||||||||||||||||
 |
|---|
| Constitution
|
| The Crown
|
| Regeringen The Government of Denmark Landsstýri The Government of the Faroe Islands |
| |
| |
|
| Related topics
|
|


General elections were held in the Faroe Islands on 7 July 1994.
Results
 | |||||
|---|---|---|---|---|---|
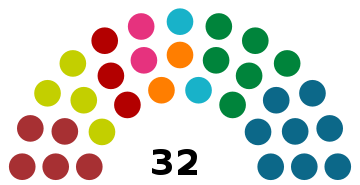
| Party | Votes | % | Seats | +/– | |
| Union Party | 5,986 | 23.42 | 8 | +2 | |
| People's Party | 4,093 | 16.01 | 6 | –1 | |
| Social Democratic Party | 3,917 | 15.32 | 5 | –5 | |
| Republican Party | 3,507 | 13.72 | 4 | 0 | |
| Workers' Union | 2,421 | 9.47 | 3 | New | |
| Christian People's Party | 1,606 | 6.28 | 2 | 0 | |
| Centre Party | 1,491 | 5.83 | 2 | New | |
| Self-Government Party | 1,437 | 5.62 | 2 | –1 | |
| Faroese Party | 616 | 2.41 | 0 | New | |
| Freedom Union | 487 | 1.91 | 0 | New | |
| Total | 25,561 | 100.00 | 32 | 0 | |
| Valid votes | 25,561 | 98.70 | |||
| Invalid/blank votes | 336 | 1.30 | |||
| Total votes | 25,897 | 100.00 | |||
| Registered voters/turnout | 31,373 | 82.55 | |||
| Source: Árbók fyri Føroyar 2003 | |||||
See also
| |
|---|---|
| Løgting elections |
|
| Referendums | |
See also: Elections and referendums in Denmark | |

 | This Faroe Islands article is a stub. You can help Wikipedia by expanding it. |
- v
- t
- e
This European election-related article is a stub. You can help Wikipedia by expanding it. |
- v
- t
- e


