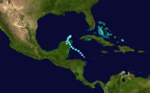
2020 Atlantic hurricane season
| 2020 Atlantic hurricane season | |
|---|---|
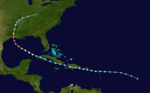
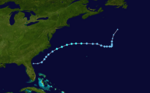
 Season summary map | |
| Seasonal boundaries | |
| First system formed | May 16, 2020 |
| Last system dissipated | November 18, 2020 |
| Strongest storm | |
| Name | Iota |
| • Maximum winds | 155 mph (250 km/h) (1-minute sustained) |
| • Lowest pressure | 917 mbar (hPa; 27.08 inHg) |
| Seasonal statistics | |
| Total depressions | 31 (record high, tied with 2005) |
| Total storms | 30 (record high) |
| Hurricanes | 14 |
| Major hurricanes (Cat. 3+) | 7 (record high, tied with 2005) |
| Total fatalities | 432 total |
| Total damage | > $55.394 billion (2020 USD) |
| Related articles | |
| |
| Atlantic hurricane seasons 2018, 2019, 2020, 2021, 2022 | |
The 2020 Atlantic hurricane season is the most active Atlantic hurricane season on record, in terms of number of systems. It featured a total of 31 tropical or subtropical cyclones, with all but one cyclone becoming a named storm. Of the 30 named storms, 14 developed into hurricanes, and a record-tying seven further intensified into major hurricanes.[nb 1] It was the second and final season to use the Greek letter storm naming system, the first being 2005, the previous record. Of the 30 named storms, 11 of them made landfall in the contiguous United States, breaking the record of nine set in 1916. During the season, 27 tropical storms established a new record for earliest formation date by storm number.[nb 2] This season also featured a record ten tropical cyclones that underwent rapid intensification, tying it with 1995, as well as tying the record for most Category 4 hurricanes in a singular season in the Atlantic Basin. This unprecedented activity was fueled by a La Niña that developed in the summer months of 2020, continuing a stretch of above-average seasonal activity that began in 2016. Despite the record-high activity, this was the first season since 2015 in which no Category 5 hurricanes formed.[nb 3]
The season officially started on June 1 and officially ended on November 30. However, tropical cyclogenesis is possible at any time of the year, as demonstrated by the early formation of Tropical Storms Arthur and Bertha, on May 16 and 27, respectively. This was the sixth consecutive year with a pre-season system and the second of these seasons to have two, with the other being 2016.[4] The first hurricane, Hurricane Hanna, made landfall in Texas on July 25. Hurricane Isaias formed on July 31, and made landfall in The Bahamas and North Carolina in early August, both times as a Category 1 hurricane; Isaias caused $4.8 billion in damage overall.[nb 4] In late August, Laura made landfall in Louisiana as a Category 4 hurricane, becoming the strongest tropical cyclone on record in terms of wind speed to make landfall in the state, alongside the 1856 Last Island hurricane and Ida. Laura caused at least $19 billion in damage and 77 deaths. September was the most active month on record in the Atlantic, with ten named storms. Slow-moving Hurricane Sally impacted the United States Gulf Coast, causing severe flooding. The Greek alphabet was used for only the second and final time, starting on September 17 with Subtropical Storm Alpha, which made landfall in Portugal on the following day.
Hurricane Zeta struck Louisiana on October 28, becoming the fourth named storm of the season to make landfall in the state, tying the record set in 2002. Zeta also struck the United States later in the calendar year than any major hurricane on record. On the last day of October, Hurricane Eta formed and made landfall in Nicaragua at Category 4 strength on November 3. Eta ultimately led to the deaths of at least 175 people and caused $8.3 billion in damage. Then, on November 10, Tropical Storm Theta became the record-breaking 29th named storm of the season and, three days later, Hurricane Iota formed in the Caribbean. Iota rapidly intensified into a high-end Category 4 hurricane, which also made 2020 the only recorded season with two major hurricanes in November. Iota ultimately made landfall in the same general area of Nicaragua that Eta had just weeks earlier and caused catastrophic damage. Overall, the tropical cyclones of the 2020 Atlantic hurricane season collectively caused at least 432 deaths and over $55.4 billion in damage, totaling to the seventh costliest season on record.
All forecasting agencies predicted above-average activity, some well-above-average, citing factors such as the expectation of low wind shear, abnormally warm sea surface temperatures, and a neutral El Niño–Southern Oscillation or La Niña. Climate change likely played a role in the record-breaking season, with respect to intensity and rainfall. However, each prediction, even those issued during the season, underestimated the actual amount of activity. Early in 2020, officials in the United States expressed concerns the hurricane season could exacerbate the effects of the COVID-19 pandemic for coastal residents due to the potential for a breakdown of safety protocols such as social distancing and stay-at-home orders.
Seasonal forecasts
| Source | Date | Named storms | Hurricanes | Major hurricanes | Ref |
| Average (1981–2010) | 12.1 | 6.4 | 2.7 | [1] | |
| Record high activity | 30‡ | 15 | 7† | [5] | |
| Record low activity | 1 | 0† | 0† | [5] | |
| TSR | December 19, 2019 | 15 | 7 | 4 | [6] |
| CSU | April 2, 2020 | 16 | 8 | 4 | [7] |
| TSR | April 7, 2020 | 16 | 8 | 3 | [8] |
| UA | April 13, 2020 | 19 | 10 | 5 | [9] |
| TWC | April 15, 2020 | 18 | 9 | 4 | [10] |
| NCSU | April 17, 2020 | 18–22 | 8–11 | 3–5 | [11] |
| PSU | April 21, 2020 | 15–24 | n/a | n/a | [12] |
| SMN | May 20, 2020 | 15–19 | 7–9 | 3–4 | [13] |
| UKMO* | May 20, 2020 | 13* | 7* | 3* | [14] |
| NOAA | May 21, 2020 | 13–19 | 6–10 | 3–6 | [15] |
| TSR | May 28, 2020 | 17 | 8 | 3 | [16] |
| CSU | June 4, 2020 | 19 | 9 | 4 | [17] |
| UA | June 12, 2020 | 17 | 11 | 4 | [18] |
| CSU | July 7, 2020 | 20 | 9 | 4 | [19] |
| TSR | July 7, 2020 | 18 | 8 | 4 | [20] |
| TWC | July 16, 2020 | 20 | 8 | 4 | [21] |
| CSU | August 5, 2020 | 24 | 12 | 5 | [22] |
| TSR | August 5, 2020 | 24 | 10 | 4 | [23] |
| NOAA | August 6, 2020 | 19–25 | 7–11 | 3–6 | [24] |
| Actual activity | 30 | 14 | 7 | ||
| * June–November only ‡ New record for activity † Most recent of several such occurrences (See all) | |||||
Forecasts of hurricane activity are issued before each hurricane season by noted hurricane experts, such as Philip J. Klotzbach and his associates at Colorado State University (CSU), and separately by NOAA forecasters. Klotzbach's team (formerly led by William M. Gray) defined the average (1981 to 2010) hurricane season as featuring 12.1 tropical storms, 6.4 hurricanes, 2.7 major hurricanes (storms reaching at least Category 3 strength in the Saffir–Simpson scale), and an accumulated cyclone energy (ACE) index of 106 units.[7] Broadly speaking, ACE is a measure of the power of a tropical or subtropical storm multiplied by the length of time it existed. It is only calculated for full advisories on specific tropical and subtropical systems reaching or exceeding wind speeds of 39 mph (63 km/h). NOAA defines a season as above normal, near normal or below normal by a combination of the number of named storms, the number reaching hurricane strength, the number reaching major hurricane strength, and the ACE Index.[1]
The first seasonal forecast was released on December 19, 2019, by Tropical Storm Risk (TSR), a public consortium consisting of experts on insurance, risk management, and seasonal climate forecasting at University College London, anticipating a slightly above-average hurricane season. This forecast was based on the prediction of near-average trade winds and slightly warmer than normal sea surface temperatures as well as a neutral El Niño–Southern Oscillation (ENSO) phase in the equatorial Pacific.[6] In April and May 2020, various agencies issued forecasts for the season, with a hyperactive season predicted by the University of Arizona (UA) and North Carolina State University.[9][11] The CSU anticipated heightened probabilities for hurricanes striking the Caribbean and the United States.[7] On May 20, the UK Met Office predicted average activity with 13 tropical storms, 7 hurricanes, and 3 major hurricanes.[14] A day later, NOAA released their forecast for an above-normal season, citing the continued ENSO-neutral or even La Niña conditions during the peak of the season.[15]
After the season began, agencies updated their forecasts and generally anticipated an active year.[17][18] The Atlantic experienced anomalously low wind shear and surface pressures during the month of July, leading to forecasts for a near-record-breaking season. The CSU and TSR predicted a total of 24 named storms, and NOAA predicted between 19–25 named storms. This was one of the most active forecasts ever released by NOAA for an Atlantic hurricane season.[25][26][24]
Seasonal summary

Overall, the Atlantic tropical cyclones of 2020 collectively resulted in 416 deaths and more than $51.114 billion in damage,[27] making the season the fifth costliest on record.[28] The 2020 Atlantic hurricane season officially began on June 1 and ended on November 30.[9] However, tropical cyclogenesis began in the month of May, with tropical storms Arthur and Bertha, marking the sixth consecutive year with an off-season storm. It was the first year with two pre-season storms since 2016, and the first to have two named storms in May since 2012.[29] The season featured 31 tropical depressions,[30] 30 of which became tropical or subtropical storms. The latter total surpassed the previous record of 28 set in 2005.[31] There were 14 huricanes, which was the second most for a season,[31] behind only 2005.[32] Seven of the hurricanes intensified into major hurricanes, tying 2005 for the most in one season.[33] It was the fifth consecutive Atlantic hurricane season with above average activity, exceeding the previous longest streak of four years between 1998 and 2001. A total of 10 tropical cyclones underwent rapid intensification, tying the record set in 1995.[31]
The season extended the warm phase of the Atlantic multidecadal oscillation ongoing since 1995. The warm AMO tends to produce tropical cyclones that are more intense and have longer durations. The presence of a La Niña contributed to the unprecedented amount of activity. Sea surface temperatures across the Atlantic basin were warmer-than-average. A strong west African monsoon, favorable wind patterns from Africa, weaker vertical wind shear all aided in the formation of tropical cyclones.[34] The ACE index for the 2020 Atlantic hurricane season was 179.8 units,[35] reflecting the season's well-above-average activity.[36] Climate change likely played a role in the record-breaking season. Scientific American noted that "As the oceans absorb more and more of the excess heat trapped by greenhouse gases, waters will get warmer earlier in the season, which could help set new records in the future."[37] A formal attribution study showed that the extreme rainfall was higher than in a counterfactual without climate change, especially for high-intensity storms.[38] Matthew Rosencrans, the lead forecaster at the National Weather Service, emphasized that climate change has been linked to the intensity of storms and their slow movements, but not to the amount of activity, which might instead be increasing due to improvements in technology.[39]
The season occurred during the COVID-19 pandemic. Early in the year, officials in the United States expressed concerns the hurricane season could potentially exacerbate the effects of the pandemic for U.S. coastal residents.[40] As expressed in an op-ed of the Journal of the American Medical Association, "there exists an inherent incompatibility between strategies for population protection from hurricane hazards: evacuation and sheltering (i.e., transporting and gathering people together in groups)", and "effective approaches to slow the spread of COVID-19: physical distancing and stay-at-home orders (i.e., separating and keeping people apart)."[41] A study published by GeoHealth in December 2020 confirmed a correlation between destination counties (a county in which an evacuee flees to) and an increase in COVID-19 cases.[42]
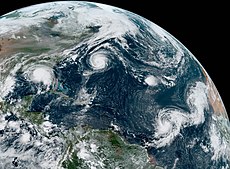
The season featured activity at a record pace. The third named storm and each one from the fifth onwards formed on an earlier date in the year than the corresponding storm in any other season since reliable records began in 1851.[37] In late July, Hanna struck South Texas as the first hurricane of the season.[43] It was followed by the second hurricane of the season, Isaias, which moved through the Caribbean and eastern United States.[44] July 2020 tied 2005 for the most active July on record in the basin, with five named storms.[45][46] Laura and Marco formed toward the end of August, and the former became the first major hurricane of the season. Laura made landfall in southwest Louisiana on August 27 at Category 4 strength with 150 mph (240 km/h) winds.[47][48] September featured the formations of nine named storms, coinciding with the peak of the hurricane season and the development of La Niña conditions.[49][50][51] Hurricane Nana hit Belize in early September.[52] Paulette was the first hurricane to hit Bermuda since Gonzalo in 2014.[53] Hurricane Sally hit the Gulf Coast of the United States as a slow-moving Category 2 hurricane.[54] Teddy, the season's eighth hurricane and second major hurricane formed on September 12,[55] while Vicky formed two days later. With the formation of the latter, five tropical cyclones were simultaneously active in the Atlantic basin for the first time since 1971.[49] Alpha developed atypically far east in the Atlantic and became the first tropical cyclone on record to strike Portugal.[56] Beta's intensification into a tropical storm made September 2020 the most active month on record, with 10 named storms.[30] Beta went on to make landfall in Texas and impact the Deep South before dissipating,[57] marking an abrupt end to the heavy peak season activity.[37]
October and November were extremely active, with seven named storms developing, five of which intensified into major hurricanes – more than twice the number recorded during this period in any previous season.[58] Hurricane Gamma hit the Yucatán Peninsula in early October before being absorbed by Hurricane Delta, which hit the region a few days later. Delta struck Louisiana as a hurricane on October 9.[59][60] Hurricane Epsilon became a major hurricane near Bermuda.[61] Toward the end of the month, Hurricane Zeta struck the Yucatán Peninsula and later Louisiana, becoming the latest landfall for a major hurricane in the continental United States.[62] In November, two Category 4 hurricanes hit Nicaragua within a two week period. Hurricane Eta moved from Central America to the Greater Antilles and southeastern United States. The season's final hurricane was also its strongest. Hurricane Iota attained maximum sustained winds of 155 mph (249 km/h) and a minimum barometric pressure of 917 mbar (27.1 inHg), before hitting Nicaragua.[3] The 2020 season became the first with two major hurricanes in the month of November.[63]
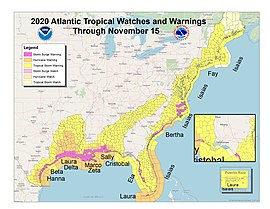
A total of eleven named storms made landfall in the United States,[34] breaking the previous record of nine in 1916. Six hurricanes hit the country, tying 1886 and 1985 for the most hurricane landfalls in a single season.[31] Eight of the eleven named storms struck the Gulf Coast of the United States.[63] Damage throughout the season totaled about $37 billion, including six hurricanes that inflicted at least $1 billion in damage; this was two more than the previous record of four in 2004 and 2005. Nearly the entire coastline from Texas to Maine was placed under some form of a watch or warning in relation to a tropical system,[31] with only Florida's Jefferson and Wakulla counties being the exception.[64] Only five counties along the East Coast or Gulf Coast of the United States did not experience tropical storm-force winds. Louisiana in particular was heavily impacted in 2020, with the state recording four landfalls – three hurricanes and one tropical storm – tying the record set in 2002.[63] Outside the United States, a record 13 landfalls occurred.[63] The two November hurricanes in Central America set back economic development in Honduras by 22 years.[31]
Systems
Tropical Storm Arthur
| Tropical storm (SSHWS) | |
  | |
| Duration | May 16 – May 19 |
|---|---|
| Peak intensity | 60 mph (95 km/h) (1-min); 990 mbar (hPa) |
The first tropical depression of the season formed on May 16 about 125 mi (200 km) east of Melbourne, Florida. It quickly intensified into Tropical Storm Arthur, reaching peak winds of 60 mph (95 km/h) and a minimum barometric pressure of 990 mbar (29 inHg) on May 19. A day later, Arthur interacted with a non-tropical front and became an extratropical cyclone. The low turned southeast before dissipating near Bermuda a day later.[65] The precursor of Arthur dropped heavy rainfall over portions of the Bahamas, Cuba, and Florida, reaching 9.95 in (253 mm) near Marathon, Florida.[65] The storm caused $112,000 in damage.[66] Arthur later produced rainfall and storm surge flooding across North Carolina.[65]
Tropical Storm Bertha
| Tropical storm (SSHWS) | |
  | |
| Duration | May 27 – May 28 |
|---|---|
| Peak intensity | 50 mph (85 km/h) (1-min); 1005 mbar (hPa) |
Tropical Storm Bertha developed off the northeast coast of Florida on May 27, reaching peak winds of 50 mph (80 km/h) and a central pressure of 1,005 mbar (29.7 inHg). That day, the storm made landfall near Isle of Palms, South Carolina, and quickly weakened into a tropical depression. Early on May 28, Bertha transitioned into an extratropical cyclone over western Virginia, before dissipating over the Northern Panhandle of West Virginia.[67] In Florida, the precursor of Bertha brought up to 15 in (380 mm) of rainfall and localized flooding to the Miami area.[67][68] One person drowned in South Carolina due to rip currents generated by the storm.[69] Overall, Bertha left at least $133,000 in damage.[70][71]
Tropical Storm Cristobal
| Tropical storm (SSHWS) | |
  | |
| Duration | June 1 – June 9 |
|---|---|
| Peak intensity | 60 mph (95 km/h) (1-min); 988 mbar (hPa) |
On June 1, the remnants of Eastern Pacific Tropical Storm Amanda entered the Bay of Campeche, quickly redeveloping into Tropical Depression Three. On the next day, it strengthened into Tropical Storm Cristobal, which strengthened while moving southeastward.[nb 6] The storm made landfall just west of Ciudad del Carmen at 13:35 UTC on June 3 at its peak intensity of 60 mph (95 km/h). Cristobal weakened into a tropical depression over land, but restrengthened as it moved back over the Gulf of Mexico. Cristobal dropped rainfall throughout the Yucatán Peninsula, reaching 9.6 in (243 mm). Three people died in Mexico due to the storm.[72] In El Salvador, a mudslide caused seven people to go missing.[73] Once back over water, Cristobal reattained winds of 60 mph (95 km/h) before encountering unfavorable conditions. Late on June 7, the storm moved ashore southeastern Louisiana, and weakened to a tropical depression as it continued northward. Cristobal became an extratropical low on June 10 over Iowa, and lasted two more days before dissipating over the Hudson Bay.[72] Cristobal killed three people in the United States.[72] Overall damage was estimated at US$665 million.[74]
Tropical Storm Dolly
| Tropical storm (SSHWS) | |
  | |
| Duration | June 22 – June 24 |
|---|---|
| Peak intensity | 45 mph (75 km/h) (1-min); 1000 mbar (hPa) |
Around June 17, an area of disturbed weather developed just north of the Bahamas after part of a tropical wave and an upper-level trough interacted. The disturbance moved north and organized into a low-pressure area early on June 22. Shortly thereafter, the low became a subtropical depression about 405 mi (650 km) east-southeast of Cape Cod, Massachusetts. Mid-level dry air and sea surface temperatures that were only marginally favorable resulted in very little strengthening on June 22. However, after moving east-northeastward and away from an upper low, the cyclone developed more deep convection and intensified into Subtropical Storm Dolly by 06:00 UTC on June 23. About six hours later, Dolly transitioned into a tropical cyclone and peaked with sustained winds of 45 mph (72 km/h) and a minimum pressure of 1,000 mbar (30 inHg). However, convection rapidly diminished after Dolly moved north of the Gulf Stream and encountered drier air. Early on June 24, Dolly degenerated into a remnant low about 200 mi (320 km) south of Sable Island. The remnant low continued northeastward and dissipated south of Newfoundland early the next day.[75]
Tropical Storm Edouard
| Tropical storm (SSHWS) | |
  | |
| Duration | July 4 – July 6 |
|---|---|
| Peak intensity | 45 mph (75 km/h) (1-min); 1005 mbar (hPa) |
A weak frontal system led to the development of a tropical depression on July 4, located about 290 mi (465 km) west-southwest of Bermuda. The depression passed about 70 mi (110 km) northwest of Bermuda around 08:00 UTC on July 5, producing wind gusts of 43 mph (68 km/h). Moving northeastward, the depression strengthened into Tropical Storm Edouard on July 6, reaching peak winds of 45 mph (72 km/h) and a minimum barometric pressure of 1,005 mbar (29.7 inHg). Soon after, Edouard merged with an approaching frontal system, which continued across the Atlantic Ocean, eventually moving across Ireland and Great Britain. The low dissipated on July 9.[76] Edouard's extratropical remnants brought rainfall to western Europe.[77][78]
Tropical Storm Fay
| Tropical storm (SSHWS) | |
  | |
| Duration | July 9 – July 11 |
|---|---|
| Peak intensity | 60 mph (95 km/h) (1-min); 998 mbar (hPa) |
The same trough that produced Tropical Storm Edouard also produced an area of thunderstorms over the northern Gulf of Mexico on July 5. After moving across the southeastern United States, the system developed into Tropical Storm Fay on July 9 near Cape Hatteras, North Carolina. Moving northward, the storm reached peak winds of 60 mph (95 km/h) and a minimum pressure of 998 mbar (29. 47 inHg) late on July 10. At 20:00 UTC that day, Fay made landfall near Atlantic City, New Jersey, with winds of 50 mph (80 km/h). It quickly lost intensity inland, degenerating into a remnant low while over southeastern New York and later being absorbed into a larger mid-latitude low over southeastern Canada.[79]
Fay directly caused the deaths of two people, who drowned due to rip currents; four others drowned due to the residual high surf conditions after Fay had passed by.[79] Overall, damage from the storm in the Northeastern United States totaled at least $350 million.[74] New Jersey experienced some of the worst impacts from Fay. Heavy rainfall caused flooding in several Jersey Shore towns and resulted in closures along many roadways, including the New Jersey Turnpike.[80] Wind gusts up to 54 mph (87 km/h) left at least 10,000 people in the state without electricity.[79][81]
Tropical Storm Gonzalo
| Tropical storm (SSHWS) | |
  | |
| Duration | July 21 – July 25 |
|---|---|
| Peak intensity | 65 mph (100 km/h) (1-min); 997 mbar (hPa) |
A dry, thermal low-pressure area merged with a tropical wave just offshore the west coast of Africa on July 15. Moving westward, the system developed into a tropical depression late on July 21 about 1,440 mi (2,315 km) east of the Windward Islands. With light wind shear warm waters, the depression intensified into Tropical Storm Gonzalo, reaching peak winds of 65 mph (105 km/h) and a minimum pressure of 997 mbar (29.4 inHg) at 06:00 UTC on July 23. Dry air from Saharan Air Layer significantly disrupted the thunderstorms, while stronger wind shear caused weakening. Gonzalo fell to tropical depression status before making landfall on Trinidad on July 25. The system degenerated into a trough early the next day near the coast of Venezuela. The storm brought squally weather to Trinidad and Tobago and parts of southern Grenada. Only two reports of wind damage were received: a fallen tree on a health facility in Les Coteaux and a damaged bus stop roof in Argyle.[82]
Hurricane Hanna
| Category 1 hurricane (SSHWS) | |
  | |
| Duration | July 23 – July 26 |
|---|---|
| Peak intensity | 90 mph (150 km/h) (1-min); 973 mbar (hPa) |
A tropical wave moved through Florida into the Gulf of Mexico, leading to the formation of a tropical depression at 00:00 UTC on July 23 about 235 mi (380 km) south-southeast of Louisiana. Moving to the west-northwest, the depression soon intensified into Tropical Storm Hanna, developing an eye. Hanna reached hurricane status on July 25, reaching peak winds of 90 mph (140 km/h) and a minimum pressure of 973 mbar (28.7 inHg) before making landfall on Padre Island, Texas, and later the Kenedy County mainland. The system rapidly weakened after moving inland, dropping to tropical depression status at 18:00 UTC on July 26 near Monterrey, Nuevo León, and then dissipating shortly thereafter.[43]
In Walton County, Florida, a 33-year-old man drowned in rip currents while rescuing his son.[43] Hanna brought storm surge flooding, destructive winds, torrential rainfall, flash flooding across South Texas. The storm destroyed several mobile homes, deroofed many poorly-built structures, and left around 200,000 homes in Cameron and Hidalgo counties combined without power. In the United States, Hanna caused about $1.1 billion in damage. In Mexico, heavy rain fell in Coahuila, Nuevo León, and Tamaulipas. The cyclone directly caused four deaths in Mexico and caused approximately $100 million in damage.[43]
Hurricane Isaias
| Category 1 hurricane (SSHWS) | |
  | |
| Duration | July 30 – August 4 |
|---|---|
| Peak intensity | 90 mph (150 km/h) (1-min); 986 mbar (hPa) |
A tropical wave moved across the Atlantic toward the end of July, leading to the development of Tropical Storm Isaias on July 30 in the eastern Caribbean Sea. Moving northwestward, Isaias struck the Dominican Republic and later the Bahamas as it intensified into a hurricane. Curving to the north, Isaias weakened to tropical storm status, but re-intensified back into a hurricane on August 3. At 03:10 UTC the next day, Isaias made landfall in Ocean Isle Beach, North Carolina, with sustained winds of 90 mph (140 km/h). It soon weakened into a tropical storm as it passed over the Mid-Atlantic states, before transitioning to an extratropical low around 00:00 UTC on August 5 while situated over central Vermont, and dissipating several hours later over Quebec.[44]
Isaias caused 17 deaths across the Greater Antilles and eastern United States: 14 in the continental United States, 2 in the Dominican Republic, and 1 in Puerto Rico. Damage estimates exceeded $4.8 billion. Isaias caused devastating flooding and wind damage in Puerto Rico and the Dominican Republic. In the United States, Isaias produced an outbreak of 39 tornadoes, including an EF3 tornado in North Carolina that killed two people. Strong winds, storm surge, and many tornadoes left significant damage in the Northeastern United States. Almost 3 million people were without electricity at the height of the storm.[44]
Tropical Depression Ten
| Tropical depression (SSHWS) | |
  | |
| Duration | July 31 – August 1 |
|---|---|
| Peak intensity | 35 mph (55 km/h) (1-min); 1008 mbar (hPa) |
On July 28, a tropical wave exited western Africa, which developed a low-pressure area that moved northward around an upper-level low. The system organized into Tropical Depression Ten on July 31 about 230 mi (370 km) east-southeast of the easternmost Cabo Verde Islands. Although Scatterometer data suggested the possibility of gale-force winds within the thunderstorms, the NHC assessed the depression to have peaked with winds of 35 mph (55 km/h) and a pressure of 1008 mbar (29.77 inHg). The depression weakened due to a combination of decreasing sea surface temperatures and dry air, degenerating into a remnant low on August 1, and dissipating a day later.[83]
Tropical Storm Josephine
| Tropical storm (SSHWS) | |
  | |
| Duration | August 11 – August 16 |
|---|---|
| Peak intensity | 45 mph (75 km/h) (1-min); 1004 mbar (hPa) |
In early August, a tropical wave moved across the tropical Atlantic, leading to the formation of Tropical Depression Eleven at 06:00 UTC on August 11 about 920 mi (1,480 km) west-southwest of the Cabo Verde Islands. Dry air and wind shear prevented further strengthening at first, but after a drop in shear, the depression became Tropical Storm Josephine at 12:00 UTC on August 13, with winds of 45 mph (70 km/h). Continued wind shear caused the storm to fluctuate in intensity, and Josephine weakened to a tropical depression on August 16 while passing north of the Leeward Islands. Soon thereafter, the system degenerated into a trough of low pressure.[84]
Tropical Storm Kyle
| Tropical storm (SSHWS) | |
  | |
| Duration | August 14 – August 15 |
|---|---|
| Peak intensity | 50 mph (85 km/h) (1-min); 1000 mbar (hPa) |
A mesoscale convective system moved offshore of South Carolina and Georgia early on August 11, which became better organized as it moved up the coast. The system developed into Tropical Storm Kyle around 12:00 UTC on August 14, about 105 mi (170 km) east-northeast of Duck, North Carolina. It moved quickly east-northwestward, reaching a peak intensity on August 15 with peak winds of 50 mph (80 km/h) and a minimum pressure at 1,000 mbar (30 inHg) while located about 230 mi (370 km) southeast of Cape Cod, Massachusetts. Kyle subsequently weakened due to wind shear, and it became an extratropical cyclone early on August 16, soon after dissipating within the front.[85] Several days later, extratropical European windstorm Ellen, which contained remnants of Tropical Storm Kyle, brought hurricane-force winds to the Republic of Ireland and the United Kingdom.[86][87]
Hurricane Laura
| Category 4 hurricane (SSHWS) | |
  | |
| Duration | August 20 – August 29 |
|---|---|
| Peak intensity | 150 mph (240 km/h) (1-min); 937 mbar (hPa) |
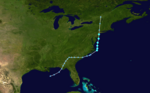
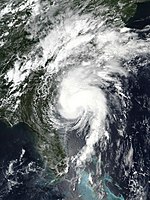
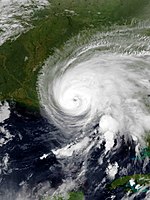
On August 16, a tropical wave exited Africa and moved across the Atlantic. Four days later, Tropical Depression Thirteen developed about 980 mi (1,580 km) east-southeast of Antigua, which quickly intensified into Tropical Storm Laura. Wind shear prohibited further intensification as the storm moved across the northern Leeward Islands, the Dominican Republic, and later Cuba. Laura entered the Gulf of Mexico later on August 25, where it became a hurricane around 12:00 UTC that day. Laura then began a period of rapid intensification, and over a 24-hour period ending at 00:00 UTC on August 27, it intensified by about 65 mph (105 km/h), to Category 4 strength. At that time, Laura reached its peak intensity with maximum sustained winds of 150 mph (240 km/h) and minimum pressure 937 mbar (27.7 inHg) while located less than 90 mi (140 km) south of Creole, Louisiana. Laura's pressure then rose slightly to 939 mbar (27.7 inHg), but the storm maintained its peak winds as it made its final landfall near Cameron, Louisiana, at 06:00 UTC.[47] The hurricane became the strongest Louisiana-landfalling tropical cyclone in terms of wind speed since the 1856 Last Island hurricane.[88] Laura weakened over land, dropping to tropical depression status over Arkansas by August 28. The deteriorating system turned northeastward and degenerated into a remnant low over northern Kentucky on August 29, which was soon absorbed by another low near the Great Lakes region.[47]
As Laura passed through the Northern Leeward Islands, it brought heavy rainfall to Guadeloupe and Dominica,[89] and prompted the closing of all ports in the British Virgin Islands.[90] The storm produced heavy downpours upon Puerto Rico and Hispaniola.[91] The storm left extensive damage in Louisiana, especially in the southwest region of the state. Storm surge penetrated up to nearly 35 mi (55 km) inland, while Creole and Grand Chenier were inundated with coastal floodwaters ranging from 12 to 18 ft (3.7 to 5.5 m) above ground, sweeping away structures in Cameron Parish. Wind gusts reached up to 153 mph (246 km/h) at Holly Beach, resulting in catastrophic wind damage in Calcasieu and Cameron parishes. Outside of the two parishes, Beauregard and Vernon parishes were next hardest hit, with the core of the storm passing directly over. Several other parishes reported damage to homes and buildings due to strong winds or falling trees.[47] Laura destroyed approximately 10,000 homes and damaged over 130,000 others in the state.[92] Damage in Louisiana alone totaled about $17.5 billion. Texas was second hardest hit by the storm, with high winds downing many power lines, power poles, and trees in the eastern part of the state, while some counties reported damage to businesses and homes. Laura produced 16 tornadoes in the United States, the most significant of them being an EF2 tornado in Randolph County, Arkansas. Altogether, there were 81 storm related deaths. Of these, 47 were direct deaths associated with Laura, including 31 in Haiti, 9 in the Dominican Republic, and 7 in the United States. There were also 34 indirect deaths, all of them in the United States.[47]
Hurricane Marco
| Category 1 hurricane (SSHWS) | |
  | |
| Duration | August 21 – August 25 |
|---|---|
| Peak intensity | 75 mph (120 km/h) (1-min); 991 mbar (hPa) |
Tropical Depression Fourteen developed on August 21 from a tropical wave near the coasts of Nicaragua and Honduras. The system moved northwestward and intensified, becoming Tropical Storm Marco around 00:00 UTC on August 22, as it moved over the northwestern Caribbean. The storm strengthened further as it moved through the Yucatán Channel.[48] Rainfall in western Cuba reached 5.72 in (145 mm) at Cape San Antonio, causing flash flooding.[48][93] Marco became a hurricane on August 23 in the southeastern Gulf of Mexico, with maximum sustained winds of 75 mph (120 km/h) and a minimum pressure of 991 mbar (29.3 inHg). Stronger wind shear caused Marco to weaken to a tropical storm on August 24 as it was approaching the coast of Louisiana. The storm turned westward and avoided moving ashore, degenerating into a remnant low on August 25 without making landfall.[48] Heavy rains fell along parts of the Gulf Coast of the United States between Florida and Mississippi, with up to 13.17 in (335 mm) of precipitation near Apalachicola, Florida.[48] Floodwaters inundated many streets in Panama City Beach.[94] Overall, Marco left approximately $35 million in damage throughout its path.[95]
Tropical Storm Omar
| Tropical storm (SSHWS) | |
  | |
| Duration | August 31 – September 5 |
|---|---|
| Peak intensity | 40 mph (65 km/h) (1-min); 1003 mbar (hPa) |
A trough exited the Southeastern United States on August 29 into the western Atlantic, which produced a low-pressure area northeast of Florida on August 30. Drifting over the Gulf Stream, the low organized into a tropical depression on August 31 while situated about 150 mi (240 km) south-southeast of Wilmington, North Carolina. Despite dry air and wind shear, the depression strengthened into Tropical Storm Omar around 12:00 UTC on September 1, with peak winds of 40 mph (65 km/h) and a minimum pressure of 1003 mbar (29.6 inHg). Continued wind shear prevented strengthening, and Omar weakened to a tropical depression early on September 3. Turning to the north, Omar degenerated into a remnant low about 575 mi (925 km) northeast of Bermuda late on September 5, which was absorbed by a frontal system on the following day.[96]
Hurricane Nana
| Category 1 hurricane (SSHWS) | |
  | |
| Duration | September 1 – September 3 |
|---|---|
| Peak intensity | 75 mph (120 km/h) (1-min); 994 mbar (hPa) |
Toward the end of August, a tropical wave moved through the Caribbean Sea, with a concentrated area of convection. On September 1, Tropical Storm Nana developed about 180 mi (290 km) southeast of Kingston, Jamaica. Despite the presence of wind shear, the storm was able to intensify, becoming a hurricane early on September 3 near the coast of Belize. At that time, Nana had maximum sustained winds of 75 mph (120 km/h) and a minimum pressure of 994 mbar (29.4 inHg). Soon after, the hurricane made landfall about 50 mi (80 km) south of Belize City, and it rapidly weakened over land, dissipating on September 4.[52] The hurricane caused more than US$20 million in damage in Belize.[97] The winds destroyed crops and caused coastal flooding.[52][98] Heavy amounts of precipitation also occurred in northern Guatemala and southeastern Mexico. The remnants later regenerated into Tropical Storm Julio in the eastern Pacific on September 5.[52]
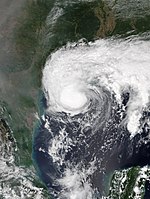
Hurricane Paulette
| Category 2 hurricane (SSHWS) | |
  | |
| Duration | September 7 – September 22 |
|---|---|
| Peak intensity | 105 mph (165 km/h) (1-min); 965 mbar (hPa) |
Tropical Depression Seventeen developed on September 7 from a tropical wave, roughly 1,150 mi (1,850 km) west of the Cabo Verde Islands. Moving west-northwestward, it quickly intensified into Tropical Storm Paulette. Wind shear impeded the storm's development, but Paulette was able to strengthen into a hurricane early on September 13, about 415 mi (670 km) southeast of Bermuda. It turned northward and made landfall on Bermuda at 08:50 UTC on September 14 with winds of 100 mph (160 km/h). The storm reached its peak intensity later that day, with maximum sustained winds of 105 mph (169 km/h) and a minimum pressure of 965 mbar (28.5 inHg). Paulette accelerated northeastward and weakened, becoming an extratropical cyclone on September 16 to the southeast of Newfoundland. After gradually weakening over the following few days and slowly curving southward, the extratropical cyclone started regenerating convection, and Paulette became a tropical storm again on September 20 about 230 mi (370 km) south-southwest of the Azores. After reaching a secondary peak of 60 mph (95 km/h), Paulette became post-tropical on September 23, which continued to meander for several days without redevelopment. The low degenerated into a trough late on September 28.[53]
Paulette caused two fatalities and one injury, due to rip currents along the east coast of the United States. Paulette produced hurricane-force winds on Bermuda, with sustained winds reaching 79 mph (127 km/h) at Pearl Island and surface-level gusts reaching 97 mph (156 km/h) at L.F. Wade International Airport. The hurricane led to 25,000 power outages, or about 70 percent of electrical customers on the island. Damage on Bermuda totaled approximately $50 million.[53]
Tropical Storm Rene
| Tropical storm (SSHWS) | |
  | |
| Duration | September 7 – September 14 |
|---|---|
| Peak intensity | 45 mph (75 km/h) (1-min); 1001 mbar (hPa) |
A tropical wave exited western Africa on September 6, leading to the formation of Tropical Depression Eighteen on September 7 about 200 mi (320 km) east of Cabo Verde. It soon strengthened into Tropical Storm Rene, which hit Boa Vista Island around 00:00 UTC on September 8 with sustained winds of 40 mph (65 km/h).[99] The storm brought gusty winds and heavy rains to Cabo Verde.[100] Rene weakened to a tropical depression several hours, but re-strengthened into a tropical storm early on September 9. At 12:00 UTC on September 10, Rene peaked with sustained winds of 45 mph (72 km/h) and a minimum pressure of 1,001 mbar (29.6 inHg). Dry air caused thunderstorms to diminish, and Rene weakened to a tropical depression on September 12. Strong westerly shear caused further weakening, with Rene degenerating into a trough on September 14 about 1,035 mi (1,665 km) northeast of the Leeward Islands. The remnants turned southwestward and dissipated a few days later.[99]
Hurricane Sally
| Category 2 hurricane (SSHWS) | |
  | |
| Duration | September 11 – September 17 |
|---|---|
| Peak intensity | 110 mph (175 km/h) (1-min); 965 mbar (hPa) |
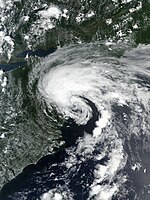
In early September, a trough developed over the western Atlantic, leading to the formation of Tropical Depression Nineteen on September 11 over the Bahamas. Moving westward, the depression made landfall near Cutler Bay, Florida early on September 12. While moving over the Everglades, the depression strengthened into Tropical Storm Sally, which soon emerged into the Gulf of Mexico. Sally moved northwestward, intensifying into a hurricane on September 14. The hurricane slowed to a crawl while turning north-northeastward, becoming a high-end Category 2 hurricane by 06:00 UTC September 16. At around 09:45 UTC that day, the system made landfall at peak intensity near Gulf Shores, Alabama, with maximum sustained winds of 110 mph (175 km/h) and a minimum central pressure of 965 mbar (28.5 inHg). Sally quickly weakened over land, becoming an extratropical low on September 17, which was later absorbed within a cold front.[54]
Across the United States, Sally was responsible for nine fatalities and approximately $7.3 billion in damage. The storm caused widespread power outages affecting at least 560,000 people. In its early stages, Sally dropped heavy rainfall in South Florida, causing flooding. The hurricane destroyed approximately 50 structures in the Florida Panhandle, while thousands of others in Escambia and Santa Rosa counties suffered damage. There were 23 tornadoes reported across the Southeastern United States while Sally was a tropical cyclone.[54]
Hurricane Teddy
| Category 4 hurricane (SSHWS) | |
  | |
| Duration | September 12 – September 23 |
|---|---|
| Peak intensity | 140 mph (220 km/h) (1-min); 945 mbar (hPa) |
A tropical wave emerged from the west coast of Africa on September 10, leading to the formation of a tropical depression two days later. On September 14 it intensified into Tropical Storm Teddy, which continued to strengthen while moving across the Atlantic Ocean. Teddy became a hurricane on September 16, and two days later it reached its peak intensity with maximum sustained winds of 140 mph (230 km/h) and a minimum barometric pressure of 945 mbar (27.9 inHg). Teddy weakened due to an eyewall replacement cycle and increased wind shear. The cyclone passed about 230 mi (370 km) east of Bermuda on September 21 as it turned north-northeastward. Teddy interacted with an approaching trough, causing the hurricane to re-intensify and become more asymmetric. The hurricane became an extratropical cyclone on September 23, and soon after moved ashore Atlantic Canada near Ecum Secum, Nova Scotia, with sustained winds of 65 mph (105 km/h). The system was eventually absorbed by a larger non-tropical low early on September 24 near eastern Labrador.[55]
Hurricane Teddy generated large ocean swells which spread along much of the U.S. Atlantic coast and from the northern Caribbean to Bermuda, killing three people. Abnormally high tides also caused coastal flooding in Charleston, South Carolina, and the Outer Banks of North Carolina. About 220 households lost power in Bermuda. The extratropical remnants of Teddy generated wind gusts up to 90 mph (145 km/h) in Nova Scotia. Approximately 18,000 customers throughout the Atlantic Canada region lost electricity. There were also isolated reports of minor flooding.[55] Damage from Teddy in all areas impacted totaled roughly $35 million.[95]
Tropical Storm Vicky
| Tropical storm (SSHWS) | |
  | |
| Duration | September 14 – September 17 |
|---|---|
| Peak intensity | 50 mph (85 km/h) (1-min); 1001 mbar (hPa) |
Early on September 11, a tropical wave exited western Africa. The next day, the system moved across the Cabo Verde Islands, producing flooding that killed one person in Praia.[101] The city recorded 5 in (88 mm) of precipitation over 24 hours. Flooding blocked several roads and damaged automobiles, bridges, buildings, and farmland.[102] Continuing to the northwest, the system developed into Tropical Depression Twenty-One on September 14, which quickly strengthened into Tropical Storm Vicky. Despite strong wind shear partially caused by Hurricane Teddy's outflow, Vicky intensified to reach peak winds of 50 mph (80 km/h) and a pressure of 1,001 mbar (29.6 inHg) on September 15. Continued wind shear caused Vicky to weaken, and the storm dissipated on September 17.[101]
Tropical Storm Wilfred
| Tropical storm (SSHWS) | |
  | |
| Duration | September 17 – September 21 |
|---|---|
| Peak intensity | 40 mph (65 km/h) (1-min); 1006 mbar (hPa) |
A tropical wave exited western Africa on September 13. After a well-defined circulation formed within an area of deep convection, the system developed into Tropical Storm Wilfred late on September 17 while situated about 345 mi (555 km) southwest of Cabo Verde. It only reached peak winds of 40 mph (65 km/h) and a minimum pressure of 1,006 mbar (29.7 inHg), before weakening due to dry air and wind shear. Wilfred weakened to a tropical depression on September 20, and degenerated into an open trough the next day about 920 mi (1,480 km) east of the northern Leeward Islands.[103]
Subtropical Storm Alpha
| Subtropical storm (SSHWS) | |
  | |
| Duration | September 17 – September 19 |
|---|---|
| Peak intensity | 50 mph (85 km/h) (1-min); 996 mbar (hPa) |
A large extratropical low developed over the northeast Atlantic Ocean on September 14, which moved south-southeastward. The wind field contracted as thunderstorms formed over the circulation. On September 17, the system developed into Subtropical Storm Alpha roughly 405 mi (650 km) east of the Azores. Alpha strengthened to attain winds of 50 mph (80 km/h) and a minimum pressure of 996 mbar (29.4 inHg). At 18:40 UTC on September 18, the cyclone made landfall about 10 mi (15 km) south of Figueira da Foz, Portugal. It dissipated by the next day.[56] Alpha caused more than $1 million in damage,[97] and resulted in one fatality due to a collapsed roof in Calzadilla, Spain.[56] The storm also spawned at least two tornadoes, both rated EF1 on the Enhanced Fujita scale. In Spain, the front associated with Alpha caused a train to derail in Madrid,[56] while thunderstorms on Ons Island caused a forest fire.[104]
Tropical Storm Beta
| Tropical storm (SSHWS) | |
  | |
| Duration | September 17 – September 22 |
|---|---|
| Peak intensity | 65 mph (100 km/h) (1-min); 993 mbar (hPa) |
An area of disturbed weather was first observed on September 5, stretching from the western Caribbean to offshore the Southeastern United States. The influence of nearby Hurricane Sally initially prevented further development. A day after that hurricane moved ashore, Tropical Depression Twenty-Two developed in the Gulf of Mexico on September 17, located about 350 mi (565 km) south-southeast of Brownsville, Texas. On September 18, the depression became Tropical Storm Beta, reaching peak winds of 65 mph (105 km/h) two days later. The storm slowed its movement,[57] resulting in upwelling, which caused weakening.[105] Beta made landfall early on September 22 near Port O'Connor, Texas, soon weakening and becoming extratropical. The low dissipated over northeastern Alabama early on September 25.[57] The storm dropped heavy rainfall, with a total of 15.77 in (401 mm) in Brookside Village, Texas. The rains led to flooding across the Greater Houston metropolitan area, resulting in a drowning death in Brays Bayou. Throughout the United States, Beta caused approximately $225 million in damage.[57] Rising floodwaters necessitated more than 100 high-water rescues and the closures of several highways and interstates in the area.[106][107]
Hurricane Gamma
| Category 1 hurricane (SSHWS) | |
  | |
| Duration | October 2 – October 6 |
|---|---|
| Peak intensity | 75 mph (120 km/h) (1-min); 978 mbar (hPa) |
A tropical depression developed on October 2 in the northwestern Caribbean Sea, about 300 mi (485 km) southeast of the Yucatán peninsula. It quickly intensified into Tropical Storm Gamma and intensified further into a hurricane, reaching winds of 75 mph (120 km/h) and a minimum pressure of 978 mbar (28.9 inHg) as it made landfall near Tulum, Quintana Roo on October 3. Gamma weakened over land and emerged into the southern Gulf of Mexico, encountering wind shear and dry air. It weakened into a tropical depression before making another landfall on the Yucatán peninsula on October 6, near San Felipe, Yucatán. Soon after, Gamma was absorbed by approaching Hurricane Delta.[59] Hurricane Gamma caused at least six deaths in Mexico, while damage was estimated at $100 million.[59][95] Precipitation peaked at 15.11 in (384 mm) in Tizimin.[59] The storm produced strong winds, heavy rainfall, flash flooding, landslides, and mudslides in the region.[108] Gamma's outerbands also produced heavy rainfall in the Cayman Islands, Cuba, and Florida.[109]
Hurricane Delta
| Category 4 hurricane (SSHWS) | |
  | |
| Duration | October 4 – October 10 |
|---|---|
| Peak intensity | 140 mph (220 km/h) (1-min); 953 mbar (hPa) |
In early October, a tropical wave moved across the Caribbean, leading to the formation of Tropical Depression Twenty-Six on October 4 to the southeast of Jamaica. It intensified into Tropical Storm Delta, and soon began a period of rapid intensification, as convection became more symmetrical. Delta became a hurricane at 00:00 October 6, and later that day peaked as a Category 4 hurricane with maximum winds of 140 mph (230 km/h) and a minimum pressure of 953 mbar (28.1 inHg). This period of rapid intensification resulted in a 105 mph (170 km/h) increase in winds over a 36-hour period, caused by a combination of extremely warm ocean water temperatures, low wind shear, and sufficient moisture. However, an increase in wind shear caused Delta to weaken, and on October 7 the hurricane struck the eastern Mexican state of Quintana Roo as a Category 2 hurricane with sustained winds of 105 mph (170 km/h). Delta weakened over land, but re-intensified over the Gulf of Mexico, reaching a secondary peak of 120 mph (195 km/h) and a minimum pressure of 953 mbar (28.1 inHg) on October 9. Later that day, unfavorable conditions caused the hurricane to weaken, and Delta made its final landfall near Creole, Louisiana with winds of 100 mph (160 km/h). The landfall was about 10 mi (15 km) east of where Hurricane Laura's eye crossed the coast on August 27. Inland, Delta weakened to tropical storm, and later became extratropical over Mississippi late on October 10. The system degenerated into a trough over Tennessee two days later.[60]
Hurricane Delta caused six fatalities, two each in the Yucatán, Louisiana, and Florida. In Mexico, damage in Mexico totaled approximately $185 million, with power outages, uprooted trees, and flooding. Damage from Delta in the United States reached $2.9 billion. The hurricane and its remnants produced heavy rain, strong winds, storm surge, and tornadoes across much of the Southeastern United States. In Louisiana, strong winds generated by Delta caused additional damage to structures that were impacted by Laura, while debris remaining from Hurricane Laura were scattered across roadways and drains. However, much of the damage in the state was caused by flooding, with 17.57 in (446 mm) of rainfall at LeBleu Settlement. Floodwaters entered several homes in Baton Rouge and Calcasieu. In Mississippi, roughly 100,000 businesses and homes lost electricity after rainfall and tropical storm-force wind gusts uprooted trees.[60]
Hurricane Epsilon
| Category 3 hurricane (SSHWS) | |
  | |
| Duration | October 19 – October 26 |
|---|---|
| Peak intensity | 115 mph (185 km/h) (1-min); 952 mbar (hPa) |
A non-tropical low formed on October 16 to the east of Bermuda. Moving southward over warmer waters, the system developed enough organized convection to become Tropical Depression Twenty-Seven on October 19. It soon intensified into Tropical Storm Epsilon as it executed a small counter-clockwise loop. Dry air and wind shear affected the storm at first, but Epsilon strengthened once the shear subsided and it began a northwest track. The storm became a hurricane on October 21, and a day later Epsilon reached maximum sustained winds of 115 mph (185 km/h) and a minimum pressure of 952 mbar (28.1 inHg). Epsilon marked the farthest east that a major hurricane had been observed after October 20. It soon weakened, passing about 185 mi (300 km) to the east of Bermuda as a minimal hurricane on October 23. After turning to the northeast, Epsilon weakened to a tropical storm, becoming an extratropical storm on October 26 about 565 mi (910 km) east of Cape Race, Newfoundland.[61] Epsilon's remnants were later absorbed into a deep extratropical low southwest of Iceland.[110]
The hurricane caused one direct death; a 27-year-old man drowned in Epsilon-induced rip currents in Daytona Beach, Florida. The hurricane also generated large sea swells from Bermuda to the Bahamas, the Greater Antilles, and the Leeward Islands. Rainfall on the island as the storm passed by amounted to less than 1 in (25 mm); winds at Bermuda's airport gusted near tropical storm-force, with a peak wind gust of 38 mph (61 km/h).[61] The trailing weather fronts associated with this low produced waves up to 98 ft (30 m) on the coast of Ireland on October 28.[111]
Hurricane Zeta
| Category 3 hurricane (SSHWS) | |
  | |
| Duration | October 24 – October 29 |
|---|---|
| Peak intensity | 115 mph (185 km/h) (1-min); 970 mbar (hPa) |
The interaction of a tropical wave and a midlevel trough led to the formation of Tropical Depression Twenty-Eight on October 24 near Grand Cayman. It quickly intensified into Tropical Storm Zeta, and reached hurricane status on October 26. That day, Zeta made landfall near Ciudad Chemuyil, Quintana Roo, with winds of 85 mph (135 km/h). After weakening to a tropical storm inland, Zeta moved offshore of the northern coast of the Yucatán Peninsula about 11 hours later. On October 28, it reattained hurricane status as it turned northward. Zeta peaked later that day at 21:00 UTC when it became a Category 3 major hurricane with maximum sustained winds of 115 mph (185 km/h) and a minimum barometric pressure of 970 mbar (29 inHg), as it made its second landfall near Cocodrie, Louisiana. Zeta steadily lost strength after landfall, weakening to a tropical storm over Alabama at 06:00 UTC on October 29, before transitioning into a post-tropical cyclone over central Virginia by 18:00 UTC that day, while moving rapidly northeastward. Early on October 30, Zeta's remnants dissipated east of the mid-Atlantic U.S. coast.[62]
Heavy rain in Jamaica caused a landslide that killed two people after demolishing a home in Saint Andrew Parish. Zeta left roughly $15 million in damage on the island.[62] Strong winds and rain caused flooding and damaged infrastructure in Mexico's Yucatán Peninsula.[112] There were seven related deaths in the United States: three in Georgia; two in Mississippi; and one each in Louisiana and Mississippi. Damage within the United States totaled $4.4 billion.[62] Zeta knocked out power to more than 2.6 million homes and businesses across the Southeastern United States; it also disrupted 2020 election early voting in several states.[113] In Louisiana, wind gusts reached 110 mph (180 km/h) at Golden Meadow, Louisiana. Zeta had damaging effects as far northeast as Virginia, while its remnants produced snow across parts of New England.[62][114]
Hurricane Eta
| Category 4 hurricane (SSHWS) | |
  | |
| Duration | October 31 – November 13 |
|---|---|
| Peak intensity | 150 mph (240 km/h) (1-min); 922 mbar (hPa) |
Toward the end of October, a tropical wave moved across the Caribbean Sea, leading to the formation of Tropical Depression Twenty-Nine late on October 31. Moving westward, it strengthened into Tropical Storm Eta and continued to intensify rapidly as it approached Central America. Late on November 2, Eta reached peak intensity with sustained maximum winds of 150 mph (240 km/h) and a minimum pressure of 922 mbar (27.2 inHg) at 06:00 UTC on November 3. Later that day, at 21:00 UTC, it made landfall south-southwest of Puerto Cabezas, Nicaragua, with winds of 140 mph (225 km/h). Over land, Eta rapidly weakened to a tropical depression and lost its surface circulation, although its mid-level center remained present. On November 6, the system redeveloped into a tropical depression, which again became a tropical storm as it moved to the northeast. Eta struck eastern Cuba as it curved back to the northwest, moving across the Florida Keys into the Gulf of Mexico on November 9. The storm briefly re-strengthened into a hurricane southwest of Florida on November 11, before weakening back to tropical storm strength. It then turned northeastward and made its final landfall near Cedar Key, Florida, at 09:00 UTC on November 12, with winds of 50 mph (80 km/h). The storm weakened over land and emerged over the Atlantic Ocean, becoming extratropical on November 13.[115]
Overall, more than 210 fatalities across Central America were attributed to the storm,[116] including 74 in Honduras, 60 in Guatemala, 27 in Mexico,[115] 19 in Panama,[117] 10 in the United States, two each in Nicaragua and Costa Rica,[115] and one in El Salvador.[118] Damage in Central America reached approximately $6.8 billion. The intense wind and rain generated by Eta caused flooding and landslides, resulting in crop losses, plus the destruction of roads, bridges, power lines and houses throughout Central America. The storm damaged or demolished at least 6,900 homes, 45 schools, 16 healthcare facilities, and some 560 mi (900 km) of bridges and roadways throughout Nicaragua. Eta also damaged hundreds of dwellings to some degree in both Guatemala and Honduras. Washed-out bridges and roads isolated more than 40 communities in the latter. In Guatemala, flooding also ruined more than 290,000 acres (119,000 ha) of crops.[115] Mexico suffered significant impacts as well, with thousands of homes damaged in Chiapas and Tabasco.[115] Relief efforts were severely hampered when, just two weeks later, Hurricane Iota made landfall approximately 15 miles (24 km) south of where Eta moved ashore.[119] Eta bought heavy rainfall and gusty winds to the Cayman Islands and Cuba, the latter of which was already dealing with overflowing rivers that prompted the evacuations of 25,000 people. The storm caused roughly $1.5 billion in damage in the United States, mostly related to flooding.[115]
Tropical Storm Theta
| Tropical storm (SSHWS) | |
  | |
| Duration | November 10 – November 15 |
|---|---|
| Peak intensity | 70 mph (110 km/h) (1-min); 987 mbar (hPa) |
On November 6, the NHC began monitoring a non-tropical area of disturbed weather in the central Atlantic for possible gradual subtropical development.[120] A non-tropical low subsequently formed about 1,300 mi (2,100 km) west-southwest of the Azores on November 8. The system became better organized as it began to detach from a frontal boundary during the following day. At 00:00 UTC on November 10, it developed into Subtropical Storm Theta. By 18:00 UTC that afternoon, the storm had transitioned into a tropical storm; it simultaneously attained what would be its peak intensity, with maximum winds of 70 mph (110 km/h) and a minimum pressure of 987 mbar (29.1 inHg). By the following morning, the effects of strong southwesterly shear had weakened Theta somewhat, though it soon began to regain some strength, and by 00:00 UTC on November 12, re-intensified to its earlier peak. Steady weakening occurred on November 13–14, as the storm experienced strong northerly vertical shear. By 06:00 UTC on November 15, Theta had weakened to a tropical depression about 120 mi (195 km) southwest of Madeira Island, and it degenerated to a remnant low six hours later.[121]
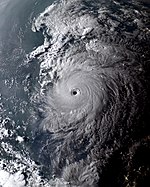
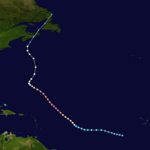
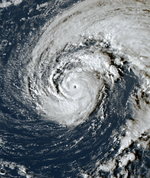
Hurricane Iota
| Category 4 hurricane (SSHWS) | |
  | |
| Duration | November 13 – November 18 |
|---|---|
| Peak intensity | 155 mph (250 km/h) (1-min); 917 mbar (hPa) |
A tropical wave exited the west coast of Africa on October 30, which eventually led to the formation of Tropical Depression Thirty-one on November 13. The depression intensified into Tropical Storm Iota as it moved westward through an area of warm waters and low wind shear. Iota rapidly intensified, becoming a hurricane on November 15, and reaching its peak intensity a day later with maximum winds of 155 mph (250 km/h) and a minimum pressure of 917 mbar (27.1 inHg), while located just 23 mi (37 km) northwest of Providencia Island. The hurricane weakened slightly before making landfall at 03:40 UTC on November 17 in eastern Nicaragua with sustained winds of 145 mph (235 km/h). Iota rapidly weakened over land, dissipating late on November 18 over El Salvador.[3] Its landfall location was approximately 15 mi (25 km) south of where Eta made landfall on November 3.[122]
Hurricane Iota caused at least 84 deaths along its path and resulted in about $1.4 billion in damage. The storm first affected Venezuela, damaging homes in Falcón state. Iota demolished approximately 98 percent of the infrastructure on Providencia Island, while also damaging hundreds of houses. Most of the damage occurred in Nicaragua and Honduras. In the former, wind damage was limited to an extent due to the recent passage of Hurricane Eta. However, the cyclone knocked down many electrical poles and deroofed many homes and a makeshift hospital in the Bilwi area. Heavy rainfall, combined with already saturated soil due to Eta, caused widespread flooding and mudslides. Heavy precipitation resulted in flooding and mudslides in Honduras, especially close to or north of Iota's path, completely destroying numerous homes. Mexico also reported extensive impacts from the storm, especially in Chiapas, Tabasco, and Veracruz. Floodwaters and mudslides damaged almost 59,000 homes and left 135 communities isolated.[3]
Storm names
The following list of names was used for named storms that formed in the North Atlantic in 2020.[123] This was the same list used for the 2014 season, as no names were retired from that year.[124] The names Isaias, Paulette, Rene, Sally, Teddy, Vicky, and Wilfred from the regular list were used for the first time in 2020, as were the auxiliary list Greek letters Eta, Theta, and Iota.[37] Isaias and Paulette replaced Ike and Paloma after 2008, but were not used in 2014. This was the second Atlantic hurricane season to exhaust the designated list of 21 storm names, and to utilize the auxiliary list, along with 2005.[125][126]
| ||
| Auxiliary list | ||
| ||
Retirement
On March 17, 2021, during the joint 42nd and 43rd Sessions of the RA IV Hurricane Committee, the World Meteorological Organization (WMO) retired the name Laura, meaning it will not be used again in the North Atlantic basin. Laura was replaced with Leah, which will first appear on the 2026 season list. The Greek letters Eta and Iota were also retired.[125][126] Although the Greek alphabet was also used in 2005,[127] the WMO decided to discontinue its use as an auxiliary list.[125] A new supplemental list consisting of 21 given names (making retirement of names feasible) was put in its place beginning with the 2021 season.[128]
The WMO did not retire the names of several 2020 hurricanes that caused extensive damage, specifically: Isaias, Sally, Delta and Zeta. This made Sally, the most destructive of the four, with a damage total of around $7.3 billion (2020 USD), the most expensive non-retired North Atlantic hurricane on record.[126][129][130]
Season effects
This is a table of all of the tropical cyclones that formed in the 2020 Atlantic hurricane season. It includes their name, duration, peak classification and intensities, areas affected, damage, and death totals. Deaths in parentheses are additional and indirect (an example of an indirect death would be a traffic accident), but were still related to that storm. Damage and deaths include totals while the storm was extratropical, a wave, or a low, and all of the damage figures are in 2020 USD.
| Saffir–Simpson scale | ||||||
| TD | TS | C1 | C2 | C3 | C4 | C5 |
| Storm name | Dates active | Storm category at peak intensity | Max 1-min wind mph (km/h) | Min. press. (mbar) | Areas affected | Damage (USD) | Deaths | Ref(s) | ||
|---|---|---|---|---|---|---|---|---|---|---|
| Arthur | May 16–19 | Tropical storm | 60 (95) | 990 | Southeastern United States, The Bahamas, Bermuda | $112,000 | None | [66] | ||
| Bertha | May 27–28 | Tropical storm | 50 (85) | 1005 | Southeastern United States, The Bahamas | > $130,000 | 1 | [67] | ||
| Cristobal | June 1–9 | Tropical storm | 60 (95) | 988 | Central America, Mexico, Central United States, Great Lakes region, Northern Ontario | ≥ $665 million | 6 | [72][74] | ||
| Dolly | June 22–24 | Tropical storm | 45 (75) | 1000 | None | None | None | |||
| Edouard | July 4–6 | Tropical storm | 45 (75) | 1005 | Bermuda, southern Ireland, southern United Kingdom | Minimal | None | |||
| Fay | July 9–11 | Tropical storm | 60 (95) | 998 | East Coast of the United States, Southeastern Canada | ≥ $220 million | 2 (4) | [74][79] | ||
| Gonzalo | July 21–25 | Tropical storm | 65 (100) | 997 | Windward Islands, Trinidad and Tobago, Venezuela | Minimal | None | |||
| Hanna | July 23–26 | Category 1 hurricane | 90 (150) | 973 | Greater Antilles, Gulf Coast of the United States, Mexico | $1.2 billion | 4 (5) | [43] | ||
| Isaias | July 30 – August 4 | Category 1 hurricane | 90 (150) | 986 | Lesser Antilles, Greater Antilles, Turks and Caicos Islands, The Bahamas, East Coast of the United States, Eastern Canada | $5.03 billion | 12 (5) | [44] | ||
| Ten | July 31 – August 1 | Tropical depression | 35 (55) | 1008 | Cabo Verde Islands | None | None | |||
| Josephine | August 11–16 | Tropical storm | 45 (75) | 1004 | None | None | None | |||
| Kyle | August 14–15 | Tropical storm | 50 (85) | 1000 | The Carolinas | None | None | |||
| Laura | August 20–29 | Category 4 hurricane | 150 (240) | 937 | Lesser Antilles, Greater Antilles, The Bahamas, Southern United States, Eastern United States | $23.3 billion | 47 (34) | [47][97] | ||
| Marco | August 21–25 | Category 1 hurricane | 75 (120) | 991 | Lesser Antilles, Venezuela, Central America, Greater Antilles, Yucatán Peninsula, Gulf Coast of the United States | ≥ $35 million | None | [131][95] | ||
| Omar | August 31 – September 5 | Tropical storm | 40 (65) | 1003 | Southeastern United States, Bermuda | None | None | |||
| Nana | September 1–3 | Category 1 hurricane | 75 (120) | 994 | Lesser Antilles, Jamaica, Cayman Islands, Central America, Southeastern Mexico | ≥ $20 million | None | [97] | ||
| Paulette | September 7–22 | Category 2 hurricane | 105 (165) | 965 | Cabo Verde Islands, Bermuda, East Coast of the United States, Azores, Madeira | > $50 million | 2 | [53][95] | ||
| Rene | September 7–14 | Tropical storm | 45 (75) | 1001 | Senegal, The Gambia, Cabo Verde Islands | Minimal | None | |||
| Sally | September 11–17 | Category 2 hurricane | 110 (175) | 965 | The Bahamas, Cuba, Southeastern United States | $7.3 billion | 4 (5) | [54] | ||
| Teddy | September 12–23 | Category 4 hurricane | 140 (220) | 945 | Lesser Antilles, Greater Antilles, Bermuda, East Coast of the United States, Atlantic Canada | > $35 million | 3 | [55][95] | ||
| Vicky | September 14–17 | Tropical storm | 50 (85) | 1001 | Cabo Verde Islands | Minimal | (1) | [101][102] | ||
| Alpha | September 17–19 | Subtropical storm | 50 (85) | 996 | Iberian Peninsula | > $24.2 million | (1) | [56][97] | ||
| Beta | September 17–22 | Tropical storm | 65 (100) | 993 | Mexico, Gulf Coast of the United States | $225 million | 1 | [57] | ||
| Wilfred | September 17–21 | Tropical storm | 40 (65) | 1006 | None | None | None | |||
| Gamma | October 2–6 | Category 1 hurricane | 75 (120) | 978 | Cayman Islands, Central America, Yucatán Peninsula | > $100 million | 6 | [59][95] | ||
| Delta | October 4–10 | Category 4 hurricane | 140 (220) | 953 | Jamaica, Cayman Islands, Central America, Yucatán Peninsula, Gulf Coast of the United States | $3.09 billion | 2 (4) | [60] | ||
| Epsilon | October 19–26 | Category 3 hurricane | 115 (185) | 952 | Bermuda | Minimal | 1 | [61] | ||
| Zeta | October 24–29 | Category 3 hurricane | 115 (185) | 970 | Cayman Islands, Jamaica, Central America, Yucatán Peninsula, Gulf Coast of the United States, East Coast of the United States | ~$4.4 billion | 7 (2) | [62] | ||
| Eta | October 31 – November 13 | Category 4 hurricane | 150 (240) | 922 | San Andrés, Jamaica, Central America, Mexico, Cayman Islands, Cuba, The Bahamas, Southeastern United States | $8.3 billion | 189 | [115][118][117] | ||
| Theta | November 10–15 | Tropical storm | 70 (110) | 987 | Canary Islands, Madeira | None | None | |||
| Iota | November 13–18 | Category 4 hurricane | 155 (250) | 917 | ABC Islands, Venezuela, Colombia, San Andrés and Providencia, Central America, Mexico | $1.4 billion | 67 (17) | [3] | ||
| Season aggregates | ||||||||||
| 31 systems | May 16 – November 18 | 155 (250) | 917 | > $55.394 billion | 354 (78) | |||||
See also
 Tropical cyclones portal

- Tropical cyclones in 2020
- List of Atlantic hurricane records
- Mediterranean tropical-like cyclone
- South Atlantic tropical cyclone
- 2020 Pacific hurricane season
- 2020 Pacific typhoon season
- 2020 North Indian Ocean cyclone season
- South-West Indian Ocean cyclone seasons: 2019–20, 2020–21
- Australian region cyclone seasons: 2019–20, 2020–21
- South Pacific cyclone seasons: 2019–20, 2020–21
Notes
- ^ Hurricanes reaching Category 3 (111 miles per hour or 179 kilometers per hour) and higher on the five-level Saffir–Simpson wind speed scale are considered major hurricanes.[1]
- ^ The record set by one storm, Tropical Storm Edouard, was broken the following year by Hurricane Elsa.[2]
- ^ Operationally, Iota was considered a Category 5 hurricane. However, post-analysis resulted in the storm being downgraded to a Category 4 hurricane.[3]
- ^ All monetary values are in 2020 United States dollars unless otherwise noted.
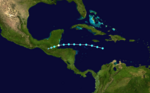
- ^ Also visible: the tropical waves that would later spawn Beta and Wilfred, respectively located to the left of Sally and to the bottom-right of Vicky; along with the extratropical cyclone that would later become Alpha, located north of Rene
- ^ According to the NHC's protocol, a tropical cyclone that degenerates into a remnant low in one basin and reforms in another is given a different name.[72]
References
- ^ a b c "Background Information: The North Atlantic Hurricane Season". Climate Prediction Center. National Oceanic and Atmospheric Administration. August 9, 2012. Archived from the original on July 31, 2012. Retrieved December 13, 2019.
- ^ Diane Pantaleo; Doyle Rice (July 2, 2021). "Category 1 Hurricane Elsa roars across Caribbean; Florida in path early next week". USA Today. Archived from the original on January 28, 2024. Retrieved August 10, 2021.
- ^ a b c d e Stacy R. Stewart (May 18, 2021). "Hurricane Iota" (PDF). Tropical Storm Report. Miami, Florida: National Hurricane Center. Archived (PDF) from the original on September 18, 2021. Retrieved May 18, 2021.
- ^ Forbes, Alex (June 1, 2022). "No Atlantic storms develop before hurricane season for first time in seven years". Macon, Georgia: WMAZ-TV. Archived from the original on January 28, 2024. Retrieved August 12, 2022.
- ^ a b "North Atlantic Ocean Historical Tropical Cyclone Statistics". Fort Collins, Colorado: Colorado State University. Archived from the original on June 4, 2023. Retrieved July 18, 2023.
- ^ a b Mark Saunders; Adam Lea (December 19, 2019). "Extended Range Forecast for Atlantic Hurricane Activity in 2020" (PDF). Tropical Storm Risk. Department of Space and Climate Physics, University College London. Archived (PDF) from the original on December 19, 2019. Retrieved December 19, 2019.
- ^ a b c Philip J. Klotzbach; Michael M. Bell; Jhordanne Jones (April 2, 2020). Extended Range Forecast of Atlantic Seasonal Hurricane Activity and Landfall Strike Probability for 2020 (PDF) (Report). Department of Atmospheric Science Colorado State University. Archived from the original (PDF) on April 2, 2020. Retrieved April 2, 2020.
- ^ Mark Saunders; Adam Lea (April 7, 2020). "April Forecast Update for North Atlantic Hurricane Activity in 2020" (PDF). Tropical Storm Risk. Department of Space and Climate Physics, University College London. Archived (PDF) from the original on June 10, 2020. Retrieved April 8, 2020.
- ^ a b c Kyle Davis; Xubin Zeng (April 14, 2020). "University of Arizona (UA) April Forecast for North Atlantic Hurricane Activity in 2020" (PDF). University of Arizona. Archived (PDF) from the original on April 17, 2020. Retrieved April 14, 2020.
- ^ Brian Donegan; Jonathan Belles (April 16, 2020). "2020 Atlantic Hurricane Season Expected to Be More Active Than Usual, The Weather Company Outlook Says". The Weather Channel. Archived from the original on April 16, 2020. Retrieved April 16, 2020.
- ^ a b Tracey Peake; Lian Xie (April 17, 2020). "2020 Hurricane Season Will Be Active, NC State Researchers Predict". North Carolina State University. Archived from the original on April 18, 2020. Retrieved April 17, 2020.
- ^ Michael E. Mann; Daniel J. Brouillette; Michael Kozar (April 21, 2020). "The 2020 North Atlantic Hurricane Season: Penn State ESSC Forecast". Pennsylvania State University. Archived from the original on May 2, 2020. Retrieved September 28, 2020.
- ^ "Pronóstico de Ciclones Tropicales 2020" (in Spanish). SMN. May 20, 2020. Archived from the original on June 2, 2020. Retrieved May 20, 2020.
- ^ a b "North Atlantic tropical storm seasonal forecast 2020". Met Office. May 20, 2020. Archived from the original on June 10, 2020. Retrieved May 20, 2020.
- ^ a b "NOAA 2020 Atlantic Hurricane Season Outlook". Climate Prediction Center. May 21, 2020. Archived from the original on June 10, 2020. Retrieved May 21, 2020.
- ^ Mark Saunders; Adam Lea (May 28, 2020). "Pre-Season Forecast for North Atlantic Hurricane Activity in 2020" (PDF). Tropical Storm Risk. Department of Space and Climate Physics, University College London. Archived (PDF) from the original on June 10, 2020. Retrieved May 28, 2020.
- ^ a b Philip J. Klotzbach; Michael M. Bell; Jhordanne Jones (June 4, 2020). Extended Range Forecast of Atlantic Seasonal Hurricane Activity and Landfall Strike Probability for 2020 (PDF) (Report). Department of Atmospheric Science Colorado State University. Archived (PDF) from the original on June 4, 2020. Retrieved June 4, 2020.
- ^ a b Kyle Davis; Xubin Zeng (June 12, 2020). "University of Arizona (UA) June Forecast for North Atlantic Hurricane Activity in 2020". University of Arizona. Archived from the original on June 14, 2020. Retrieved June 13, 2020.
- ^ Philip J. Klotzbach; Michael M. Bell; Jhordanne Jones (July 7, 2020). Extended Range Forecast of Atlantic Seasonal Hurricane Activity and Landfall Strike Probability for 2020 (PDF) (Report). Department of Atmospheric Science Colorado State University. Archived (PDF) from the original on July 7, 2020. Retrieved July 7, 2020.
- ^ Mark Saunders; Adam Lea (July 7, 2020). "July Forecast for North Atlantic Hurricane Activity in 2020" (PDF). Tropical Storm Risk. Department of Space and Climate Physics, University College London. Archived (PDF) from the original on July 8, 2020. Retrieved July 7, 2020.
- ^ "Active Atlantic Hurricane Season Outlook Update". The Weather Channel. July 16, 2020. Archived from the original on July 18, 2020. Retrieved July 16, 2020.
- ^ Philip J. Klotzbach; Michael M. Bell; Jhordanne Jones (August 5, 2020). Forecast of Atlantic Seasonal Hurricane Activity and Landfall Strike Probability for 2020 (PDF) (Report). Department of Atmospheric Science Colorado State University. Archived (PDF) from the original on August 6, 2020. Retrieved August 5, 2020.
- ^ Mark Saunders; Adam Lea (August 5, 2020). "August Forecast Update for North Atlantic Hurricane Activity in 2020" (PDF). Tropical Storm Risk. Department of Space and Climate Physics, University College London. Archived (PDF) from the original on September 13, 2020. Retrieved August 7, 2020.
- ^ a b Lauren Gache (August 6, 2020). "'Extremely active' hurricane season possible for Atlantic Basin". National Oceanic and Atmospheric Administration. Archived from the original on August 6, 2020. Retrieved August 6, 2020.
- ^ Philip J. Klotzbach; Michael M. Bell; Jhordanne Jones (August 5, 2020). Forecast of Atlantic Seasonal Hurricane Activity and Landfall Strike Probability for 2020 (PDF) (Report). Department of Atmospheric Science Colorado State University. Archived (PDF) from the original on September 2, 2020. Retrieved September 16, 2020.
- ^ Mark Saunders; Adam Lea (August 5, 2020). August Forecast Update for North Atlantic Hurricane Activity in 2020 (PDF). Tropical Storm Risk (Report). Department of Space and Climate Physics, University College London. Archived (PDF) from the original on September 13, 2020. Retrieved September 16, 2020.
- ^ * Andy Latto (September 10, 2020). "Tropical Storm Arthur" (PDF). Tropical Cyclone Report. Miami, Florida: National Hurricane Center. Archived (PDF) from the original on September 19, 2020. Retrieved September 21, 2020.
- John P. Cangialosi (September 23, 2020). "Tropical Storm Bertha" (PDF). Tropical Cyclone Report. Miami, Florida: National Hurricane Center. Archived (PDF) from the original on July 5, 2021. Retrieved September 28, 2020.
- Robbie Berg (January 13, 2021). "Tropical Storm Cristobal" (PDF). Tropical Cyclone Report. Miami, Florida: National Hurricane Center. Archived (PDF) from the original on August 24, 2021. Retrieved June 9, 2021.
- "Global Catastrophe Recap: August 2020" (PDF). Aon. p. 6. Archived (PDF) from the original on September 14, 2020. Retrieved September 14, 2020.
- John L. Beven II; Robbie Berg (March 31, 2021) [Original report date March 29, 2021]. "Tropical Storm Fay" (PDF). Tropical Cyclone Report. Miami, Florida: National Hurricane Center. Archived (PDF) from the original on June 22, 2021. Retrieved April 17, 2021.
- Daniel P. Brown; Robbie Berg; Brad Reinhart (February 11, 2021). "Hurricane Hanna" (PDF). Tropical Cyclone Report. Miami, Florida: National Hurricane Center. Archived (PDF) from the original on June 22, 2021. Retrieved February 12, 2021.
- Andy Latto; Andrew Hagen; Robbie Berg (April 15, 2021) [Original report date March 30, 2021]. "Hurricane Isaias" (PDF). Tropical Cyclone Report. Miami, Florida: National Hurricane Center. Archived (PDF) from the original on September 18, 2021. Retrieved April 14, 2021.
- Richard J. Pasch; Robbie Berg; David P. Roberts; Philippe P. Papin (May 26, 2021). "Hurricane Laura" (PDF). Tropical Cyclone Report. Miami, Florida: National Hurricane Center. Archived (PDF) from the original on September 2, 2021. Retrieved May 28, 2021.
- "Global Catastrophe Recap September 2020" (PDF). Aon. October 8, 2020. Archived from the original (PDF) on October 8, 2020. Retrieved October 8, 2020.
- Fredy Martín Pérez (August 23, 2020). "Muere niña en Chiapas por afectaciones de la tormenta tropical "Marco"". El Universal (in Spanish). Archived from the original on March 3, 2021. Retrieved August 23, 2020.
- "Global Catastrophe Recap October 2020" (PDF). Aon. November 10, 2020. Archived (PDF) from the original on November 12, 2020. Retrieved November 11, 2020.
- Andy S. Latto (April 1, 2021). "Hurricane Paulette" (PDF). Tropical Cyclone Report. Miami, Florida: National Hurricane Center. Archived (PDF) from the original on June 22, 2021. Retrieved April 13, 2021.
- Robbie Berg; Bard J. Reinhart (April 14, 2021). "Hurricane Sally" (PDF). Tropical Cyclone Report. Miami, Florida: National Hurricane Center. Archived (PDF) from the original on April 14, 2021. Retrieved April 20, 2021.
- Eric S. Blake (April 28, 2021). "Hurricane Teddy" (PDF). Tropical Cyclone Report. Miami, Florida: National Hurricane Center. Archived (PDF) from the original on September 18, 2021. Retrieved April 29, 2021.
- Richard J. Pasch (March 6, 2020). "Tropical Storm Vicky" (PDF). Tropical Cyclone Report. Miami, Florida: National Hurricane Center. Archived (PDF) from the original on June 24, 2021. Retrieved March 6, 2020.
- Daniel P. Brown (January 28, 2021). "Subtropical Storm Alpha" (PDF). Tropical Cyclone Report. National Hurricane Center. Archived (PDF) from the original on June 24, 2021. Retrieved February 2, 2021.
- John L. Beven II; Robbie Berg (April 6, 2021). "Tropical Storm Beta" (PDF). Tropical Cyclone Report. Miami, Florida: National Hurricane Center. Archived (PDF) from the original on September 16, 2021. Retrieved May 7, 2021.
- Andrew S. Latto (April 17, 2021). "Hurricane Gamma" (PDF). Tropical Cyclone Report. Miami, Florida: National Hurricane Center. Archived (PDF) from the original on September 7, 2021. Retrieved April 20, 2021.
- John P. Cangialosi; Robbie Berg (April 19, 2021) [Original report date March 30, 2021]. "Hurricane Delta" (PDF). Tropical Cyclone Report. Miami, Florida: National Hurricane Center. Archived (PDF) from the original on August 27, 2021. Retrieved May 21, 2021.
- Philippe P. Papin (April 9, 2021). "Hurricane Epsilon" (PDF). Tropical Cyclone Report. Miami, Florida: National Hurricane Center. Archived (PDF) from the original on June 24, 2021. Retrieved April 13, 2021.
- Eric Blake; Robbie Berg; Andrew Hagen (May 10, 2021). "Hurricane Zeta" (PDF). Tropical Cyclone Report. Miami, Florida: National Hurricane Center. Archived (PDF) from the original on September 2, 2021. Retrieved May 11, 2021.
- Richard J. Pasch; Brad J. Reinhart; Robbie Berg; David P. Roberts (June 9, 2021). "Hurricane Eta" (PDF). Tropical Cyclone Report. Miami Florida: National Hurricane Center. Archived (PDF) from the original on September 18, 2021. Retrieved June 9, 2021.
- "Woman in Guatemalan village hit by Storm Eta loses 22 members of her family". The Guardian. Reuters. November 7, 2020. Archived from the original on November 8, 2020. Retrieved November 8, 2020.
- "El Salvador reports first death from tropical storm Eta". Haiti News. Xinhua. November 5, 2020. Archived from the original on November 9, 2020. Retrieved November 6, 2020.
- Stacy R. Stewart (May 18, 2021). "Hurricane Iota" (PDF). Tropical Storm Report. Miami, Florida: National Hurricane Center. Archived (PDF) from the original on September 18, 2021. Retrieved May 18, 2021.
- ^ Josh Fiallo (April 8, 2021). "2021 hurricane forecast: 17 storms, 8 hurricanes, 4 major ones". Tampa Bay Times. Archived from the original on August 11, 2021. Retrieved August 10, 2021.
- ^ Jonathan Erdman (May 27, 2020). "Two Tropical Storms Form Before June 1 – Does That Mean an Active Hurricane Season Is Guaranteed?". The Weather Channel. Archived from the original on August 9, 2021. Retrieved August 9, 2021.
- ^ a b Frank Billingsley (November 30, 2020). "Hurricane season is officially ending but there's still activity". KPRC-TV. Houston, Texas. Archived from the original on December 1, 2020. Retrieved December 5, 2020.
- ^ a b c d e f Jeff Masters (December 1, 2020). "A look back at the horrific 2020 Atlantic hurricane season". Yale Climate Connections. Archived from the original on June 14, 2021. Retrieved June 25, 2021.
- ^ Chris Dolce (May 28, 2020). "15 Years Ago, the Most Extreme Atlantic Hurricane Season on Record Began". The Weather Channel. Archived from the original on August 10, 2021. Retrieved August 9, 2021.
- ^ Chris Perkins (May 12, 2021). "Hurricane Zeta reclassified as 7th major hurricane of the 2020 season, tying the 2005 record". Sun-Sentinel. Archived from the original on June 26, 2021. Retrieved June 25, 2021.
- ^ a b "Record-breaking Atlantic hurricane season draws to an end". National Oceanic and Atmospheric Administration. June 10, 2021. Archived from the original on September 9, 2021. Retrieved June 25, 2021.
- ^ "Basin Archives: North Atlantic Ocean Historical Tropical Cyclone Statistics". Fort Collins, Colorado: Colorado State University. Archived from the original on June 4, 2023. Retrieved July 8, 2022.
- ^ Philip Klotzbach; Michael Bell; Jhordanne Jones (June 3, 2021). "Extended Range Forecast of Atlantic Seasonal Hurricane Activity and Landfall Strike Probability for 2021" (PDF). Fort Collins, Colorado: Colorado State University. p. 37. Archived (PDF) from the original on January 28, 2024. Retrieved August 10, 2021.
- ^ a b c d Andrea Thompson; Amanda Montañez (December 1, 2020). "In 2020, Record-Breaking Hurricanes Arrived Early—and Often". Scientific American. Archived from the original on May 16, 2021. Retrieved June 4, 2021.
- ^ Reed, Kevin A.; Wehner, Michael F.; Zarzycki, Colin M. (2022). "Attribution of 2020 hurricane season extreme rainfall to human-induced climate change". Nature Communications. 13 (1): 1905. Bibcode:2022NatCo..13.1905R. doi:10.1038/s41467-022-29379-1. ISSN 2041-1723. PMC 9005694. PMID 35414063.
- ^ Theresa Machemer (May 21, 2021). "NOAA Predicts Another Above-Average Atlantic Hurricane Season". Smithsonian. Archived from the original on August 10, 2021. Retrieved August 10, 2021.
- ^ Kimberly Miller; Gareth McGrath (April 6, 2020) [April 2, 2021]. "Hurricanes in a pandemic: 'Absolutely that's our nightmare scenario'". USA Today. Archived from the original on April 3, 2020. Retrieved October 4, 2020.
- ^ James M. Schultz; Craig Fugate; Sandro Galea (August 12, 2020). "Cascading Risks of COVID-19 Resurgence During an Active 2020 Atlantic Hurricane Season" (PDF). Journal of the American Medical Association. 324 (10): 935–936. doi:10.1001/jama.2020.15398. PMID 32897351. S2CID 221166201. Archived (PDF) from the original on August 15, 2020. Retrieved October 4, 2020.
- ^ Sen Pei; Kristina A. Dahl; Teresa K. Yamana; Rachel Licker; Jeffrey Shaman (December 1, 2020). "Compound Risks of Hurricane Evacuation Amid the COVID-19 Pandemic in the United States". GeoHealth. 4 (12): e2020GH000319. Bibcode:2020GHeal...4..319P. doi:10.1029/2020GH000319. PMC 7704390. PMID 33299960.
- ^ a b c d e Daniel P. Brown; Robbie Berg; Brad Reinhart (February 11, 2021). "Hurricane Hanna" (PDF). Tropical Cyclone Report. Miami, Florida: National Hurricane Center. Archived (PDF) from the original on June 22, 2021. Retrieved February 12, 2021.
- ^ a b c d Andy Latto; Andrew Hagen; Robbie Berg (April 15, 2021) [Original report date March 30, 2021]. "Hurricane Isaias" (PDF). Tropical Cyclone Report. Miami, Florida: National Hurricane Center. Archived (PDF) from the original on September 18, 2021. Retrieved April 14, 2021.
- ^ Steve Bowen [@stevebowenwx] (July 30, 2020). "2020 joins 2005 as the most active July in the official record for named storm formation in the Atlantic Ocean" (Tweet). Retrieved July 31, 2020 – via Twitter.
- ^ Monthly Tropical Cyclone Summary (Report). National Hurricane Center. August 31, 2020. Archived from the original on September 13, 2020. Retrieved August 31, 2020.
- ^ a b c d e f Richard J. Pasch; Robbie Berg; David P. Roberts; Philippe P. Papin (May 26, 2021). "Hurricane Laura" (PDF). Tropical Cyclone Report. Miami, Florida: National Hurricane Center. Archived (PDF) from the original on September 2, 2021. Retrieved May 28, 2021.
- ^ a b c d e John L. Beven II; Robbie Berg (March 31, 2021). "Hurricane Marco" (PDF). Tropical Cyclone Report. Miami, Florida: National Hurricane Center. Archived (PDF) from the original on June 22, 2021. Retrieved April 24, 2021.
- ^ a b "Tropical Cyclones - September 2020". National Centers for Environmental Information. October 2020. Archived from the original on August 9, 2021. Retrieved August 9, 2021.
- ^ El Niño/Southern Oscillation (ENSO) Diagnostic Discussion (PDF) (Report). Climate Prediction Center/NCEP/NWS and the International Research Institute for Climate and Society. September 10, 2020. Archived (PDF) from the original on September 17, 2020. Retrieved September 26, 2020.
- ^ Lauren Gaches (September 10, 2020). "La Niña develops during peak hurricane season". Archived from the original on September 23, 2020. Retrieved September 26, 2020.
- ^ a b c d Daniel P. Brown (December 7, 2020). "Hurricane Nana" (PDF). Tropical Cyclone Report. Miami, Florida: National Hurricane Center. Archived (PDF) from the original on August 25, 2021. Retrieved December 8, 2020.
- ^ a b c d Andy S. Latto (April 1, 2021). "Hurricane Paulette" (PDF). Tropical Cyclone Report. Miami, Florida: National Hurricane Center. Archived (PDF) from the original on June 22, 2021. Retrieved April 13, 2021.
- ^ a b c d Robbie Berg; Bard J. Reinhart (April 14, 2021). "Hurricane Sally" (PDF). Tropical Cyclone Report. Miami, Florida: National Hurricane Center. Archived (PDF) from the original on April 14, 2021. Retrieved April 20, 2021.
- ^ a b c d Eric S. Blake (April 28, 2021). "Hurricane Teddy" (PDF). Tropical Cyclone Report. Miami, Florida: National Hurricane Center. Archived (PDF) from the original on September 18, 2021. Retrieved April 29, 2021.
- ^ a b c d e Daniel P. Brown (January 28, 2021). "Subtropical Storm Alpha" (PDF). Tropical Cyclone Report. National Hurricane Center. Archived (PDF) from the original on June 24, 2021. Retrieved February 2, 2021.
- ^ a b c d e John L. Beven II; Robbie Berg (April 6, 2021). "Tropical Storm Beta" (PDF). Tropical Cyclone Report. Miami, Florida: National Hurricane Center. Archived (PDF) from the original on September 16, 2021. Retrieved May 7, 2021.
- ^ Doyle Rice (November 30, 2020). "Record-shattering 2020 Atlantic hurricane season officially comes to an end". USA Today. Archived from the original on July 1, 2021. Retrieved December 10, 2020.
- ^ a b c d e Andrew S. Latto (April 17, 2021). "Hurricane Gamma" (PDF). Tropical Cyclone Report. Miami, Florida: National Hurricane Center. Archived (PDF) from the original on September 7, 2021. Retrieved April 20, 2021.
- ^ a b c d John P. Cangialosi; Robbie Berg (April 19, 2021) [Original report date March 30, 2021]. "Hurricane Delta" (PDF). Tropical Cyclone Report. Miami, Florida: National Hurricane Center. Archived (PDF) from the original on August 27, 2021. Retrieved May 21, 2021.
- ^ a b c d Philippe P. Papin (April 9, 2021). "Hurricane Epsilon" (PDF). Tropical Cyclone Report. Miami, Florida: National Hurricane Center. Archived (PDF) from the original on June 24, 2021. Retrieved April 13, 2021.
- ^ a b c d e f Eric Blake; Robbie Berg; Andrew Hagen (May 10, 2021). "Hurricane Zeta" (PDF). Tropical Cyclone Report. Miami, Florida: National Hurricane Center. Archived (PDF) from the original on September 2, 2021. Retrieved May 11, 2021.
- ^ a b c d Ken Graham (2021). "Record Breaking Hurricane Season 2020 and What's New for 2021" (PDF). National Oceanic and Atmospheric Administration. Archived (PDF) from the original on August 10, 2021. Retrieved August 9, 2021.
- ^ National Weather Service Corpus Christi, Texas [@NWSCorpus] (November 16, 2020). "With 30 named storms in the Atlantic Basin in 2020 and 12 of them making US landfalls, every mile of the US Atlantic coast has been under a tropical watch or warning (TS, Hur, Storm Surge). A busy season for @NWSNHC and coastal NWS offices" (Tweet). Retrieved August 9, 2021 – via Twitter.
- ^ a b c Andy Latto (September 10, 2020). "Tropical Storm Arthur" (PDF). Tropical Cyclone Report. Miami, Florida: National Hurricane Center. Archived (PDF) from the original on September 19, 2020. Retrieved September 21, 2020.
- ^ a b "Florida Event Reports for May 14–18, 2020". National Centers for Environmental Information. 2020. Archived from the original on September 13, 2020. Retrieved August 22, 2020.
- ^ a b c John P. Cangialosi (September 23, 2020). "Tropical Storm Bertha" (PDF). Tropical Cyclone Report. Miami, Florida: National Hurricane Center. Archived (PDF) from the original on July 5, 2021. Retrieved September 28, 2020.
- ^ Christian De La Rosa; Liane Morejon (May 26, 2020). "Steady downpours bring costly flooding across South Florida". WPLG. Miami, Florida. Archived from the original on June 4, 2020. Retrieved May 27, 2020.
- ^ Summer Dashe (May 27, 2020). "Drowning Reported in Myrtle Beach Wednesday After Tropical Storm Bertha Hit Coast". Archived from the original on June 6, 2020. Retrieved May 30, 2020.
- ^ [Florida Event Reports for May 25–26, 2020] (Report). National Centers for Environmental Information. 2020. Archived from the original on September 13, 2020. Retrieved August 22, 2020.
- ^ North Carolina Severe Weather Event Reports: May 27-28, 2020. National Weather Service (Report). National Center for Environmental Information. Archived from the original on September 13, 2020. Retrieved September 9, 2020.
- ^ a b c d e Robbie Berg (January 13, 2021). "Tropical Storm Cristobal" (PDF). Tropical Cyclone Report. Miami, Florida: National Hurricane Center. Archived (PDF) from the original on August 24, 2021. Retrieved June 9, 2021.
- ^ Courtney Travis (June 3, 2020). "Cristobal makes landfall in Mexico, could dump up to 30 inches of rain before heading for US". AccuWeather. Archived from the original on June 4, 2020. Retrieved January 12, 2021.
- ^ a b c d "Global Catastrophe Recap: August 2020" (PDF). Aon. p. 6. Archived (PDF) from the original on September 14, 2020. Retrieved September 14, 2020.
- ^ Eric S. Blake (January 19, 2021). "Tropical Storm Dolly" (PDF). Tropical Cyclone Report. Miami, Florida: National Hurricane Center. Archived (PDF) from the original on June 22, 2021. Retrieved January 27, 2021.
- ^ Richard J. Pasch (February 22, 2021). "Tropical Storm Edouard" (PDF). Tropical Cyclone Report. Miami, Florida: National Hurricane Center. Archived (PDF) from the original on June 22, 2021. Retrieved February 25, 2021.
- ^ "Orkaanseizoen begint op gang te komen" (in Dutch). Meteo Delfzijl. Archived from the original on November 15, 2020. Retrieved November 15, 2020.
- ^ "Gefahr von Superzellen: 80 Liter Dauerregen und gefährliche Gewitter am Nachmittag" (in German). FOCUS Online. July 10, 2020. Archived from the original on December 11, 2020. Retrieved November 15, 2020.
- ^ a b c d John L. Beven II; Robbie Berg (March 31, 2021) [Original report date March 29, 2021]. "Tropical Storm Fay" (PDF). Tropical Cyclone Report. Miami, Florida: National Hurricane Center. Archived (PDF) from the original on June 22, 2021. Retrieved April 17, 2021.
- ^ Event Review: Tropical Storm Fay, July 10 2020 (Report). National Weather Service Office in Mount Holly, New Jersey. 2020. Archived from the original on August 7, 2020. Retrieved April 5, 2021.
- ^ Tom Davis (July 10, 2020). "10K Without Power As 73-MPH Winds, Tropical Storm Fay Hit NJ". Patch.com. Archived from the original on June 4, 2021. Retrieved March 30, 2021.
- ^ Stacy R. Stewart (February 1, 2021). "Tropical Storm Gonzalo" (PDF). Tropical Cyclone Report. Miami, Florida: National Hurricane Center. Archived (PDF) from the original on June 22, 2021. Retrieved February 4, 2021.
- ^ John P. Cangialosi (December 14, 2020). "Tropical Depression Ten" (PDF). Tropical Cyclone Report. Miami, Florida: National Hurricane Center. Archived (PDF) from the original on June 22, 2021. Retrieved January 11, 2020.
- ^ Brad J. Reinhart (January 27, 2021). "Tropical Storm Josephine" (PDF). Tropical Cyclone Report. Miami, Florida: National Hurricane Center. Archived (PDF) from the original on June 22, 2021. Retrieved January 29, 2021.
- ^ Eric Blake (February 11, 2020). "Tropical Storm Kyle" (PDF). Tropical Cyclone Report. Miami, Florida: National Hurricane Center. Archived (PDF) from the original on June 22, 2021. Retrieved February 23, 2020.
- ^ Barra Best (August 19, 2020). "Storm Ellen: Warnings issued ahead of strong wind and rain". BBC News. Archived from the original on August 19, 2020. Retrieved August 20, 2020.
- ^ Marko Korosec (August 20, 2020). "Storm Ellen hit Ireland with winds of 'Category 1' hurricane strength – 130.000 homes without power". Severe Weather Europe. Archived from the original on November 24, 2020. Retrieved November 17, 2020.
- ^ Philip Klotzbach [@philklotzbach] (August 27, 2020). "Table of 11 strongest hurricanes to make landfall in Louisiana on record (since 1851) based on maximum sustained wind" (Tweet). Retrieved August 27, 2020 – via Twitter.
- ^ Jeff Masters (August 21, 2020). "Tropical Storm Laura and Tropical Depression 14 predicted to converge in Gulf of Mexico". New Haven, Connecticut: Yale Center for Environmental Communication, Yale School of the Environment. Archived from the original on August 23, 2020. Retrieved September 16, 2020.
- ^ "Territory's ports to close from today due to Tropical Storm". bvi.org. August 21, 2020. Archived from the original on August 27, 2020. Retrieved September 16, 2020.
- ^ Dánica Coto (August 23, 2020). "Tropical Storm Laura Brings Heavy Downpours to Hispaniola, Puerto Rico". WTVJ. Miami, Florida. Associated Press. Archived from the original on November 22, 2020. Retrieved November 22, 2020.
- ^ Princella Tally (March 5, 2021). "Homeless have no shelter from storms". The Chronicle. Archived from the original on June 7, 2021. Retrieved June 6, 2021.
- ^ Hugo Solano (August 24, 2020). "Afectación por tormenta Marco dejó en tres días en Santa Cruz más del doble de la lluvia que cae en todo el mes". La Nación (in Spanish). Archived from the original on August 25, 2020. Retrieved August 24, 2020.
- ^ "Marco Weakens and May Still Bring Heavy Rain to Parts of Gulf Coast Into Tuesday". The Weather Channel. August 24, 2020. Archived from the original on August 26, 2020. Retrieved June 25, 2021.
- ^ a b c d e f g "Global Catastrophe Recap October 2020" (PDF). Aon. November 10, 2020. Archived (PDF) from the original on November 12, 2020. Retrieved November 11, 2020.
- ^ Stacy R. Stewart (January 31, 2021). "Tropical Storm Omar" (PDF). Tropical Cyclone Report. National Hurricane Center. Archived (PDF) from the original on June 22, 2021. Retrieved February 2, 2021.
- ^ a b c d e "Global Catastrophe Recap September 2020" (PDF). Aon. October 8, 2020. Archived from the original (PDF) on October 8, 2020. Retrieved October 8, 2020.
- ^ Janice Dean; Travis Fedschun (September 3, 2020). "Hurricane Nana makes landfall in Belize, brings floods to Honduras; Omar to dissipate". Fox News. Archived from the original on September 14, 2020. Retrieved September 16, 2020.
- ^ a b John P. Cangialosi (January 7, 2021). "Tropical Storm Rene" (PDF). Tropical Cyclone Report. National Hurricane Center. Archived (PDF) from the original on June 24, 2021. Retrieved January 12, 2021.
- ^ Katie Sewell (September 8, 2020). "Tropical Storm Rene path: Rene blasts Cabo Verde Islands as NHC forecast hurricane upgrade". Daily Express. Archived from the original on September 10, 2020. Retrieved January 12, 2021.
- ^ a b c Richard J. Pasch (March 6, 2020). "Tropical Storm Vicky" (PDF). Tropical Cyclone Report. Miami, Florida: National Hurricane Center. Archived (PDF) from the original on June 24, 2021. Retrieved March 6, 2020.
- ^ a b "Cape Verde – Deadly Flash Floods in Praia". FloodList. September 15, 2020. Archived from the original on September 16, 2020. Retrieved September 16, 2020.
- ^ Stacy R. Stewart (December 31, 2020). "Tropical Storm Wilfred" (PDF). Tropical Cyclone Report. National Hurricane Center. Archived (PDF) from the original on July 5, 2021. Retrieved February 2, 2021.
- ^ "Los estragos del temporal: Una mujer muere en Cáceres al caer un tejado y un tren descarrila en Madrid". Telecinco (in European Spanish). September 18, 2020. Archived from the original on July 5, 2021. Retrieved February 2, 2021.
- ^ John L. Beven II (September 19, 2020). "Tropical Storm Beta Discussion Number 9". Miami, Florida: National Hurricane Center. Archived from the original on October 19, 2020. Retrieved September 20, 2020.
- ^ Janet Shamlian (September 22, 2020). "Remnants of Tropical Storm Beta slam Texas with relentless rain and flooding". CBS News. Archived from the original on June 23, 2021. Retrieved June 17, 2021.
- ^ Ron Brackett (September 22, 2020). "Tropical Storm Beta Floods Houston Area; Standing Water Closes Interstate, Highways". The Weather Channel. Archived from the original on September 23, 2020. Retrieved June 17, 2021.
- ^ "Desalojos masivos de hoteles y alerta roja en México ante la proximidad del huracán Delta, ahora de categoría 3". Univision (in Spanish). October 6, 2020. Archived from the original on November 18, 2020. Retrieved October 12, 2020.
- ^ Travis Fedschun (October 4, 2020). "Tropical Storm Gamma meanders off Mexico, bringing flooding and storm surge". Fox News. Archived from the original on January 20, 2021. Retrieved August 9, 2021.
- ^ Rebecca Day (October 28, 2020). "What the Met Office say about Hurricane Epsilon hitting this week". Manchester Evening News. Chadderton, Greater Manchester, England. Archived from the original on October 30, 2020. Retrieved October 28, 2020.
- ^ Angie Phillips (October 29, 2020). "Hurricane Epsilon sends huge waves to NI coastline". BBC News. Archived from the original on May 8, 2021. Retrieved November 18, 2020.
- ^ "Hurricane Zeta downs trees, power lines as it crosses Yucatán Peninsula". Riviera Maya News. Riviera Maya, Quintana Roo. October 27, 2020. Archived from the original on November 30, 2020. Retrieved November 23, 2020.
- ^ Doyle Rice (October 29, 2020). "6 dead, millions powerless as Zeta roars across southern, eastern US". USA Today. Archived from the original on October 30, 2020. Retrieved October 29, 2020.
- ^ Cindy Day (November 2, 2020). "WEATHER U: The science behind the snowicane". The Chronicle Herald. Halifax, Nova Scotia. Archived from the original on December 1, 2020. Retrieved November 30, 2020.
- ^ a b c d e f g Richard J. Pasch; Brad J. Reinhart; Robbie Berg; David P. Roberts (June 9, 2021). "Hurricane Eta" (PDF). Tropical Cyclone Report. Miami Florida: National Hurricane Center. Archived (PDF) from the original on September 18, 2021. Retrieved June 9, 2021.
- ^ "Global Catastrophe Recap November 2020" (PDF). Aon. December 10, 2020. Archived (PDF) from the original on May 27, 2021. Retrieved December 24, 2020.
- ^ a b "Woman in Guatemalan village hit by Storm Eta loses 22 members of her family". The Guardian. Reuters. November 7, 2020. Archived from the original on November 8, 2020. Retrieved November 8, 2020.
- ^ a b "El Salvador reports first death from tropical storm Eta". Haiti News. Xinhua. November 5, 2020. Archived from the original on November 9, 2020. Retrieved November 6, 2020.
- ^ Emily Shapiro, Max Golembo (November 17, 2020). "Record-breaking Hurricane Iota to bring dangerous flooding to Central America". ABC News. Archived from the original on December 2, 2020. Retrieved November 17, 2020.
- ^ Phillipe P. Pappin; David Zelinsky (November 6, 2020). "Tropical Weather Outlook". NHC Graphical Outlook Archive. Miami Florida: National Hurricane Center. Archived from the original on April 4, 2021. Retrieved May 20, 2021.
- ^ John L. Beven II (April 12, 2021). "Tropical Storm Theta" (PDF). Tropical Cyclone Report. Miami, Florida: National Hurricane Center. Archived (PDF) from the original on April 12, 2021. Retrieved April 13, 2021.
- ^ Stacy Stewart; Andrew Latto (November 16, 2020). "Hurricane Iota Tropical Cyclone Update". Miami, Florida: National Hurricane Center. Archived from the original on November 27, 2020. Retrieved November 17, 2020.
- ^ National Hurricane Operations Plan (PDF) (Report). Washington, D.C.: NOAA Office of the Federal Coordinator for Meteorological Services and Supporting Research. May 2020. p. 3-8. Archived (PDF) from the original on January 23, 2024. Retrieved January 23, 2024.
- ^ Donegan, Brian (February 25, 2020). "2020 Hurricane Season Is Less Than 100 Days Away; Here Are the Names You'll See This Year". The Weather Channel. Archived from the original on August 11, 2021. Retrieved August 10, 2021.
- ^ a b c "WMO Hurricane Committee retires tropical cyclone names and ends the use of Greek alphabet". Geneva, Switzerland: World Meteorological Organization. March 17, 2021. Archived from the original on December 18, 2023. Retrieved March 17, 2021.
- ^ a b c Masters, Jeff (March 19, 2021). "WMO: Atlantic hurricanes no longer to receive names from Greek alphabet". New Haven, Connecticut: Yale Climate Connections. Archived from the original on March 19, 2021. Retrieved January 23, 2024.
- ^ Chris Dolce (October 6, 2020). "Here's What Happens If a Tropical Storm or Hurricane With a Greek Alphabet Name Needs to Be Retired". The Weather Channel. Archived from the original on December 21, 2020. Retrieved December 19, 2020.
- ^ Seth Borenstein (March 17, 2021). "Bye Alpha, Eta: Greek Alphabet Ditched for Hurricane Names". U.S. News & World Report. Associated Press. Archived from the original on June 24, 2021. Retrieved June 19, 2021.
- ^ Del Santo, T. J. (March 17, 2021). "Greek alphabet retired for hurricane names; 'Isaias' still available". Providence, Rhode Island: WPRI-TV. Archived from the original on October 18, 2021. Retrieved October 18, 2021.
- ^ Erdman, Jonathan (March 19, 2021). "These 2019 and 2020 Atlantic Hurricane Names Were Not Retired, But Were Strong Candidates". The Weather Company. Archived from the original on March 20, 2021. Retrieved October 18, 2021.
- ^ Fredy Martín Pérez (August 23, 2020). "Muere niña en Chiapas por afectaciones de la tormenta tropical "Marco"". El Universal (in Spanish). Archived from the original on March 3, 2021. Retrieved August 23, 2020.
External links
Wikimedia Commons has media related to 2020 Atlantic hurricane season.
- National Hurricane Center Website
- Atlantic Tropical Cyclone Reports
- v
- t
- e
Tropical cyclones of the 2020 Atlantic hurricane season
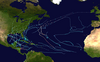
 Category


 2020_Atlantic_hurricane_season